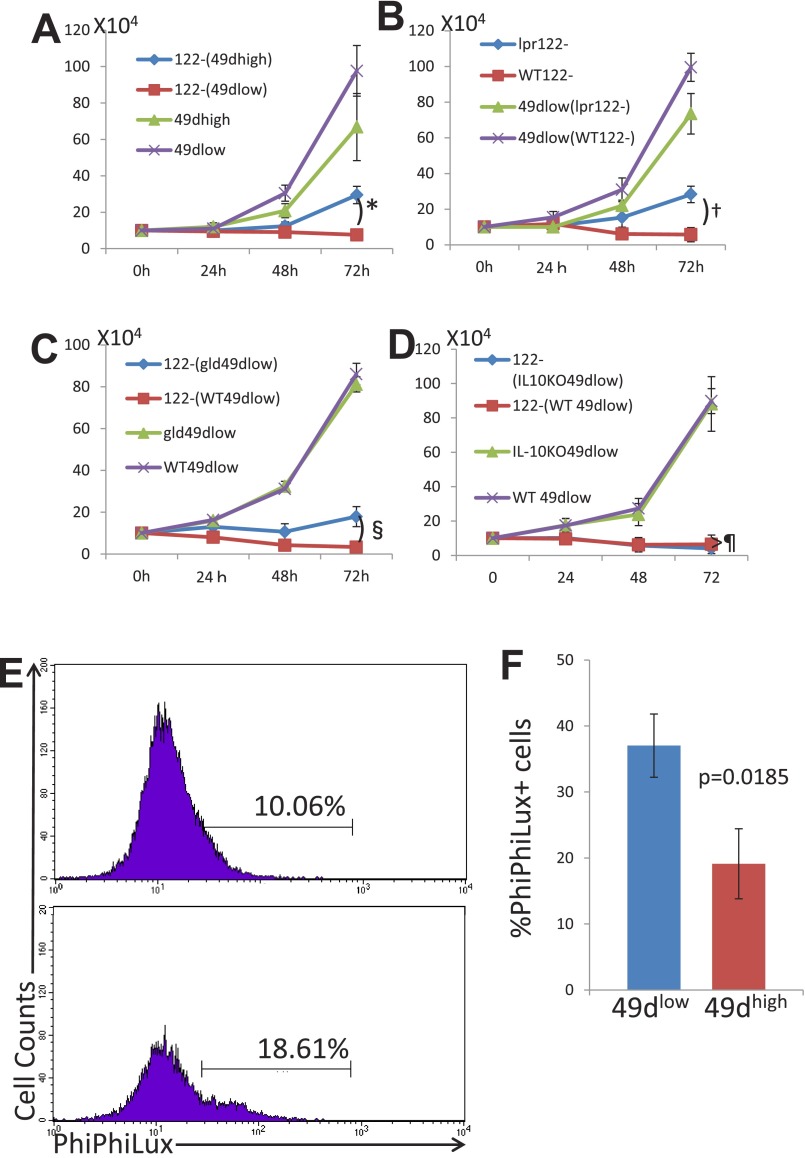
Fig. S1.
(A) Experiment was performed as described for Fig. 1D, and the data were exchanged to absolute numbers of cells by calculating the total numbers of cells obtained by counting cells in a counting chamber times the percentages of the cell of interest obtained by the flow-cytometric analysis. 122−(49dhigh), CD8+CD122− cells cocultured with CD8+CD122+CD49dhigh cells; 122–(49dlow), CD8+CD122− cells cocultured with CD8+CD122+CD49dlow cells. *Significantly different (P = 0.0096, Student’s t test). (B) Experiment was performed as described in Fig. 2B, and the data were exchanged to absolute numbers of cells as in A. 49dlow(lpr122–), CD8+CD122+CD49dlow cells cocultured with C57BL/6lpr/pr mice-derived CD8+CD122− cells; 49dlow(WT122–), CD8+CD122+CD49dlow cells cocultured with wild-type C57BL/6 mice-derived CD8+CD122− cells. †Significantly different (P = 0.0175, Student’s t test). (C) Experiment was performed as described in Fig. 3D, and the data were exchanged to absolute numbers of cells as in A. 122–(gld49dlow), CD8+CD122− cells cocultured with C57BL/6gld/gld mice-derived CD8+CD122+CD49dlow cells; 122–(WT49dlow), CD8+CD122− cells cocultured with wild-type C57BL/6 mice-derived CD8+CD122+CD49dlow cells. §Significantly different (P = 0.0165, Student’s t test). (D) Experiment was performed as described in Fig. 5B, and the data were exchanged to absolute numbers of cells as in A. 122–(IL-10KO49dlow), CD8+CD122− cells cocultured with C57BL/6IL-10KO mice-derived CD8+CD122+CD49dlow cells; 122–(WT49dlow), CD8+CD122− cells cocultured with wild-type C57BL/6 mice-derived CD8+CD122+CD49dlow cells. ¶Not significantly different (P = 0.5071, Student’s t test). (E) Coculture assay was performed as described in Fig. 1, and after 48 h of coculture, cells were subjected to the assay for PhiPhiLux. Cells were treated with the PhiPhiLux system according to the protocol provided by the manufacturer and subsequently analyzed by FACSCalibur flow cytometer. Cells stained with anti–CD45.1-PE (originally CD122−) are shown as histogram analysis. Percentages of cells positive for PhiPhiLux are shown. Data are representative of three independent experiments. (F) Analysis of PhiPhiLux, indicating activity of caspase 3, is shown as a bar graph. Statistically significant difference was observed between the cells cocultured with different cells indicated in the panel. The data are averages of three independent experiments.

