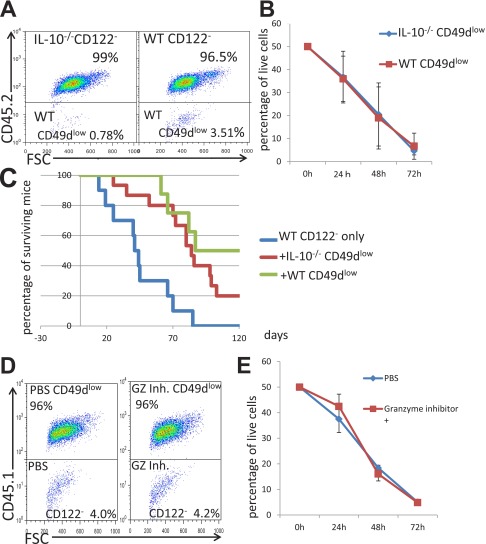
Fig. S2.
(A) After 24 h of culture with the stimulation by anti-CD3 Ab and 72 h of coculture of WT CD8+CD122− T cells (CD45.1) and CD8+CD122+CD49dlow T cells (CD45.2), derived from IL-10–deficient mice (Left) or wild-type mice (Right), the cells were stained and analyzed. Representative results obtained after 72 h of coculture are shown. Percentages of cells in the upper or lower rectangle among total remaining live cells are shown. (B) CD8+CD122− T cells (CD45.1) and CD8+CD122+CD49dlow T cells (CD45.2) from WT mice and IL-10–deficient mice were cocultured and analyzed. The percentages of CD8+CD122− cells among total live cells are shown as the averages and SDs obtained from three independent experiments. At all time points, the values were not significantly different (P > 0.05, Student’s t test) between data obtained from IL-10–deficient mice-derived cells and those obtained from WT mice-derived cells. (C) CD8+CD122− T cells (4 × 10⁵ per recipient mouse) obtained from wild-type mice were mixed with CD8+CD122+CD49dlow T cells (1 × 10⁵ per recipient mouse) taken from WT mice and IL-10–deficient mice and were then i.v. transferred into RAG-2–deficient mice. The survival of the T-cell–recipient mice was followed up to 140 d after adoptive T-cell transfer, and the results are presented as Kaplan–Meier curves. Addition of IL-10−/−–derived CD8+CD122+CD49dlow T cells to CD122− cells (red line) led to significantly higher survival of mice compared with transfer of CD122− cells alone (blue line; log-rank test, P = 0.0166; Wilcoxon test, P = 0.0287), but survival of these mice was not significantly different from that obtained by addition of WT CD8+CD122+CD49dlow cells (green line; log-rank test, P = 0.4891; Wilcoxon test, P = 0.3927). (D and E) Analysis of granzyme B activity in coculture using granzyme B Inhibitor I (Calbiochem, Merck Millipore). Representative results of simultaneous experiments with (Right) and without granzyme inhibitor (Left; control) are shown (D). Red line, granzyme inhibitor (+); blue line, granzyme inhibitor (–). At all time points examined, the values in the culture containing the granzyme inhibitor did not differ significantly from that without the granzyme inhibitor at the same time point (P > 0.05, Student’s t test) (E). The data are averages of three independent experiments.

