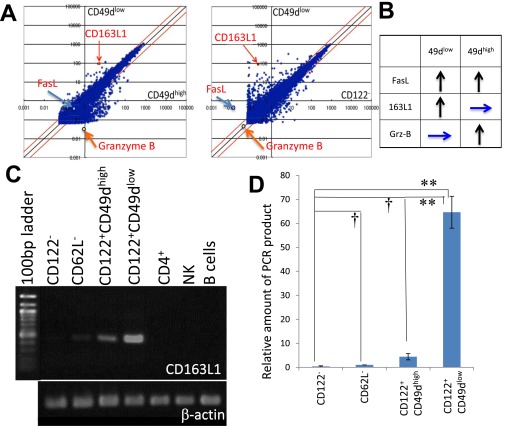
Fig. S3.
Search for genes specifically expressed in a subpopulation of CD8+ T cells. (A) Scatter plots comparing gene expression in CD8+CD122+CD49dlow cells (vertical axis) versus CD8+CD122+CD49high cells (horizontal axis in Left panel) and in CD8+CD122− cells (horizontal axis in Right panel). Arrows indicate the positions of CD163L1, Fas, and granzyme B. (B) Relative expression intensity of FasL, CD163L1, and granzyme B in CD8+CD122+CD49dhigh and CD8+CD122+CD49dlow cells compared with that in CD8+CD122− cells is summarized. Upward arrows illustrate higher expression in the indicated cells than in CD122− cells, and horizontal arrows illustrate no difference in expression between the indicated cells and CD122− cells. (C) RT-PCR analysis of CD163L1 in various lymphocytes and CD8+ T-cell subsets. cDNA was prepared by reverse transcription of RNA extracted from the indicated T-cell subsets and PCR-amplified with CD163L1-specific primers. The PCR products were electrophoresed in agarose gels and stained with ethidium bromide. PCR products were normalized by the intensities of β-actin. (D) Quantification of CD163L1 expression in various CD8+ T-cell subsets by real-time PCR analysis. RNA extracted from the indicated T-cell subsets was used to quantify the mRNA levels with SYBR Premix Ex Taq II (TAKARA). The amount of PCR products is shown on a relative scale setting, with that of CD62L− set as 1.00. Differences in expression between CD122− and other cells (CD62L−, CD49dhigh, and CD49dlow) were statistically analyzed. †Not significantly different. **Significantly different (P < 0.01, Student's t test).

