
Figure 7. Congruent connectivity profiles across all PMC clusters.
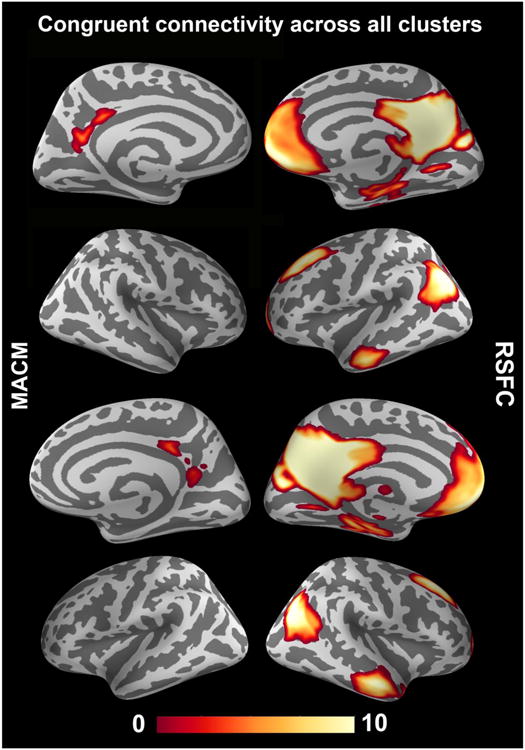
Depicts topographical overlap between the (cluster-level-corrected) whole-brain connectivity maps of the four PMC clusters (cf. Fig. 5). This AND conjunction was computed separately based on task-related meta-analytic connectivity modeling (MACM; left column) and task-unrelated resting-state functional connectivity (RSFC; right column) to quantify conjoint functional coupling of the PMC clusters across experimentally constrained (left column) and unconstrained (right column) brain states. The color bar on the bottom indicates z-values. Whole-brain renderings were created using PySurfer (http://pysurfer.github.io/).