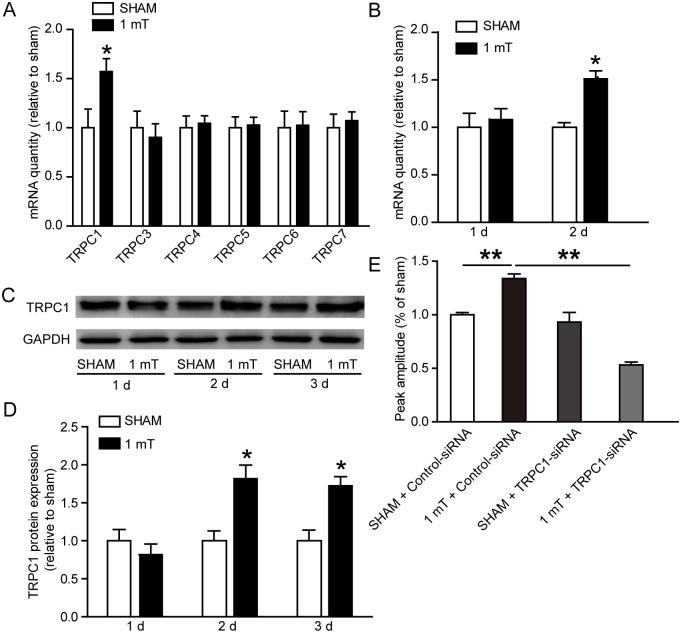
Fig 7. Effects of ELF-EMF exposure on TRPC1 expression and function.
(A) mRNA expression of TRPC channels. Differentiating eNSCs were exposed to ELF-EMF for 3 days. * p < 0.05 vs. sham groups. (B) The mRNA expression of TRPC1 after ELF-EMF exposure for 1 day and 2 days. * p < 0.05 vs. sham groups. (C, D) Representative western blotting bands showing the TRPC1 protein expression and the statistical results. * p < 0.05 vs. sham groups. Full-length blots are presented in S4C Fig. (E) The changes in the intracellular Ca2+ concentration (indicated by F340/380 ratio) were measured with or without the TRPC1-siRNA treatment. The results were expressed as the peak amplitude relative to sham. ** p < 0.01. For all experiments, the data are from five independent experiments and are presented as the mean ± SEM.

