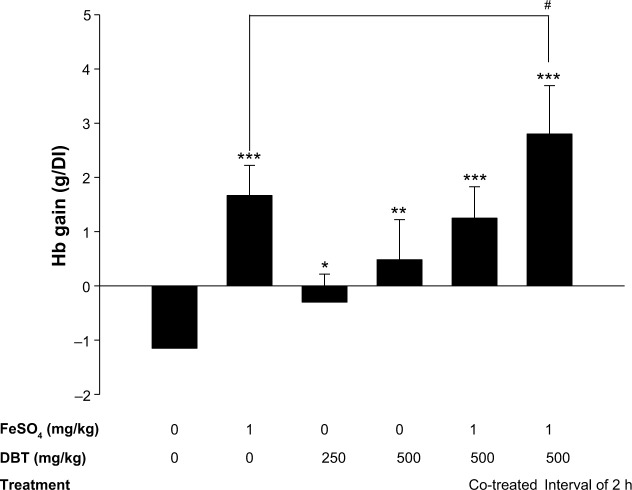
Figure 5.
The gain in Hb in DIA rats with an interval of 2 h between the administration of DBT and FeSO4.
Notes: Bars represent the mean ± standard deviation of six rats per group. Statistically significantly differs from the blank group at *P<0.05; **P<0.001; ***P<0.0001. Statistically significantly differs from the FeSO4-only group at #P<0.05.
Abbreviations: DBT, Dang-Gui-Bu-Xue-Tang; DIA, diet-induced anemia; Hb, hemoglobin; h, hours.

