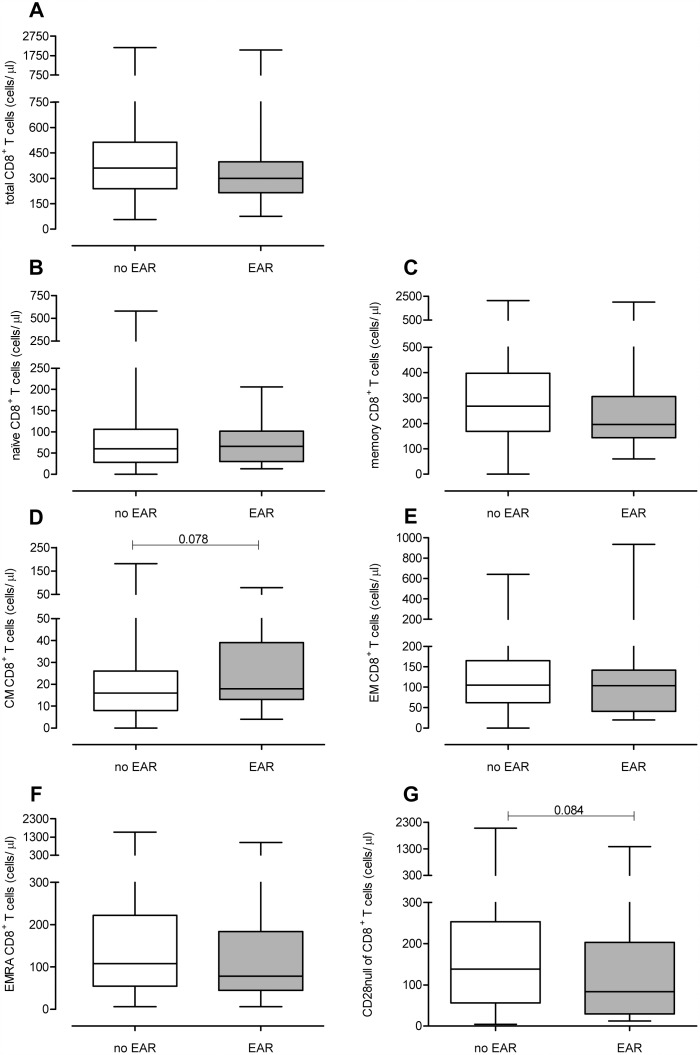
Fig 2. CD8+ T-cell differentiation status prior to KT.
Absolute numbers of (A) total, (B) naive, (C) memory, (D) CM, (E) EM, (F) EMRA and (G) CD28null CD8+ T cells are shown for the no rejection (white boxplot, n = 192) and EAR (grey boxplot, n = 30) group of patients. Significant differences were calculated and shown (*p<0.05, **p<0.01, **p<0.001).

