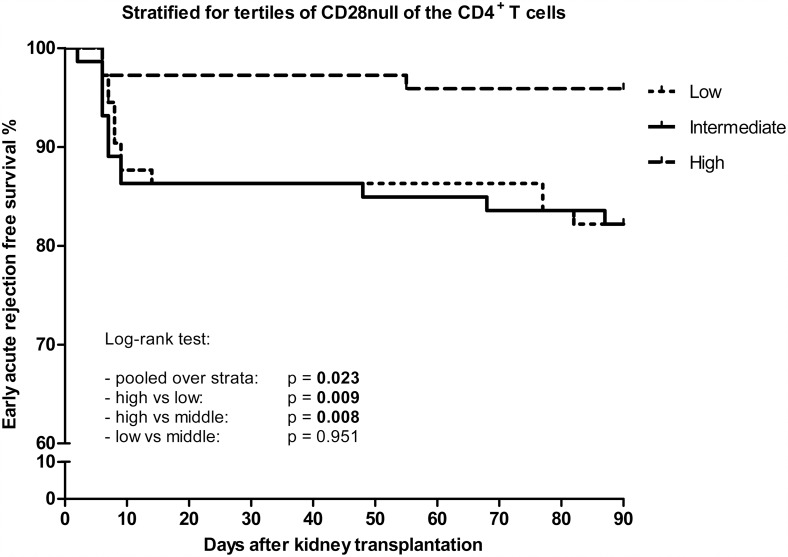
Fig 3. Tertiles of CD4+CD28null T cells and EAR free survival.
Kaplan-Meier curve representing EAR free survival rate against time after kidney transplantation in days. The curves represent the tertiles of CD4+CD28null T cells. Low represents <4.33 cells/μl, intermediate represents 4.33–36.67 cells/μl and high represents >36.67 cells/μl. These groups were created based upon the frequencies of the cell numbers in our cohort and were divided into three equal groups.

