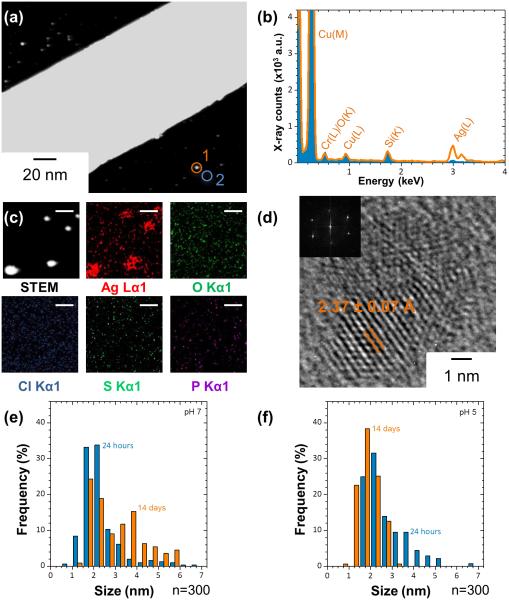
Figure 6.
HAADF STEM imaging, STEM/EDX elemental analysis and mapping and HRTEM characterization of the secondary nanoparticles from the original AgNWs. (a) STEM image of AgNWs incubated in pH7 perchlorate buffers for 7 days. The image reveals the presence of a large number of small particles on the surface and around the AgNWs. (b) STEM/EDX spectrum of a single nanoparticle, collected from the circled area 1 in (a) and comparison with the background spectrum, collected from the circled area 2 in (a). (c) HAADF STEM imaging and EDX elemental mapping. Scale bar 10 nm. (d) HRTEM of nanoparticles formed after the incubation of AgNWs at pH7 for 7 days. The lattice spacing of the nanoparticles corresponds to that of metallic Ag (111). (e-f) Size distribution of the AgNPs generated after the incubation of AgNWs at pH7 (e) and pH5 (f), for 24 hours and 14 days.

