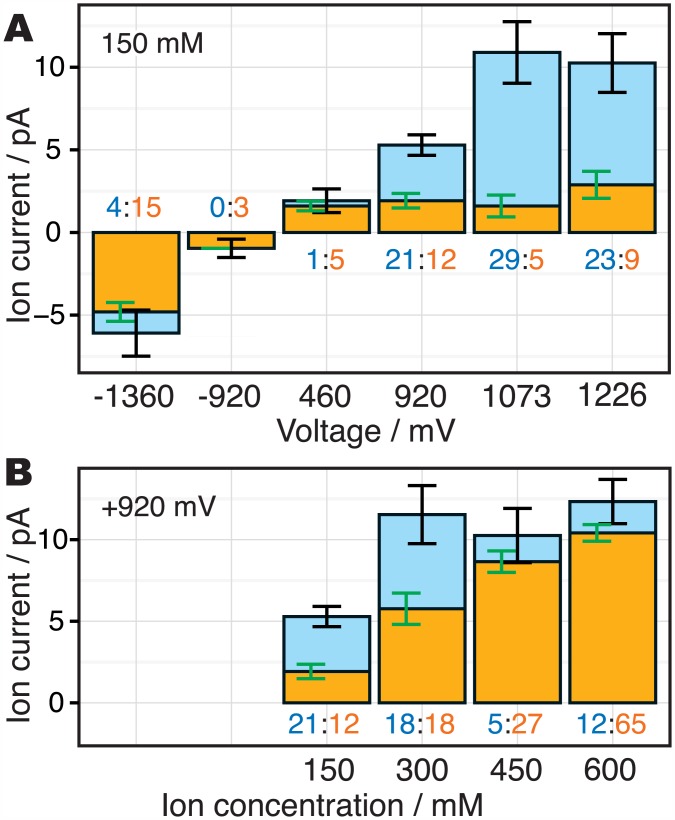
Fig 5. The ratios of the ion conduction mechanisms observed during the simulations.
The orange and cyan bars indicate the ratios of the III-IV-III and III-II-III conductions, respectively. The orange and cyan values along with each bar indicate observed number of ion conduction events in each mechanism (note that the length of the simulation trajectories are not the same among the trajectories; the two trajectories, 150 mM with +920 mV and 600 mM with +920 mV, are 1.0 μs and others are 0.5 μs). The error bars show the bootstrap errors of the ion current (black) and the ratio of the mechanisms (green). (A) The dependency of the ion conduction mechanisms on the membrane voltage. (B) The dependency of the ion conduction mechanisms on the ion concentrations, taken from our previous study [28].

