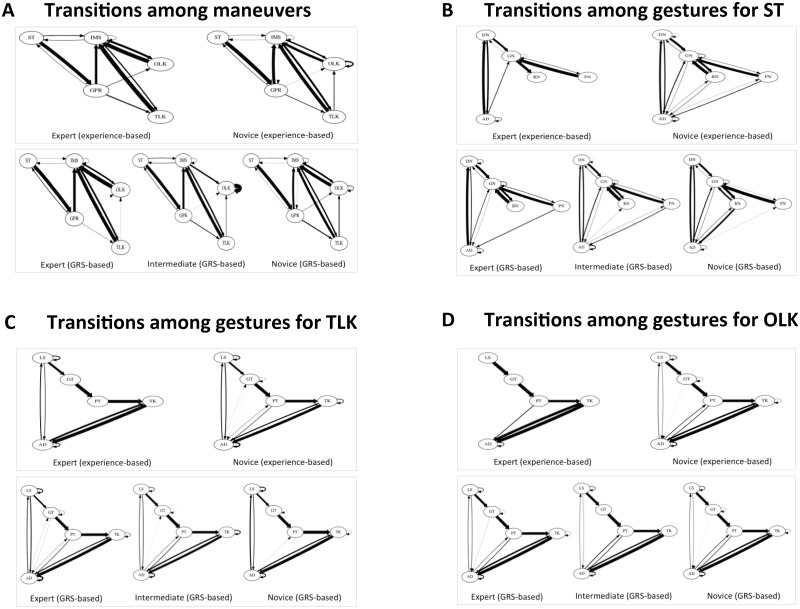
Fig 5. State flow plots showing transitions among maneuvers in a surgeon’s knot and among gestures in its constituent maneuvers by skill level.
ST = suture throw; IMS = inter-maneuver segment; GPR = grasp-pull-run suture through tissue; OLK = one-loop knot; TLK = two-loop knot; GRS = global rating score; DN = drive needle; GN = grasp needle; RN = rotate needle out of tissue; PN = pull needle; AD = adjustment gestures; LS = loop suture; GT = grasp suture tail through loop; PT = pull suture tail through loop; TK = pull ends of suture to tighten knot. An arrow in the Fig 5 represents a transition from a maneuver shown at the tail to the maneuver shown at the head of the arrow. The thickness of the arrow corresponds to the fraction of total transitions arising out of the maneuver from which the arrow originates.

