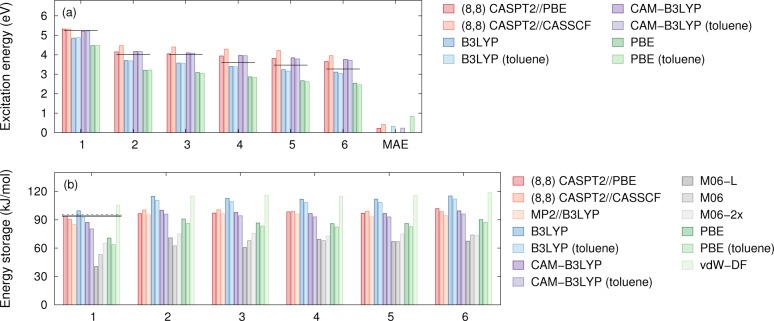
Figure 3.
(a) Experimental (horizontal black lines, Gray et al.17) and computational excitation energies from (8,8) 2-SA-MS CASPT2 calculations (both DFT-PBE and CASSCF geometries) and various DFT exchange-correlation functionals. The last block reports the mean absolute error (MAE) relative to the experimental reference data. (b) Energy storage ΔE for compounds 1–6. The solid and dashed horizontal lines represent experimental and CCSD(T) values, respectively, for the storage energy ΔE of 1. More details regarding the latter can be found in the Supporting Information.

