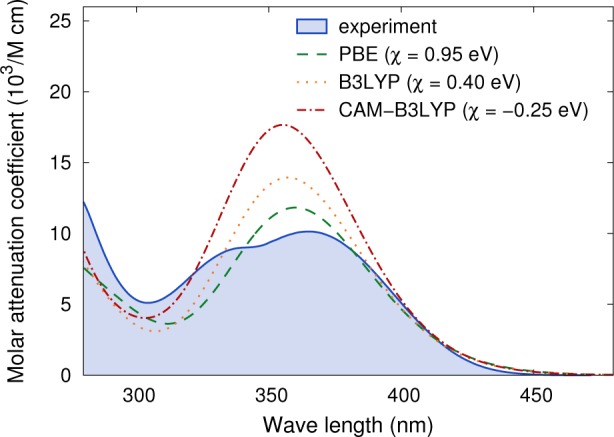
Figure 5.

Comparison of the molar attenuation coefficient of compound 6 from experiment17 and DFT calculations. A smearing using a width of 0.25 eV was applied to the latter in order to mimic the broadening due to vibrations. The calculated spectra were rigidly shifted by a scissors correction χ for clarity. Detailed comparisons for all compounds can be found in the Supporting Information.
