
Figure 3.
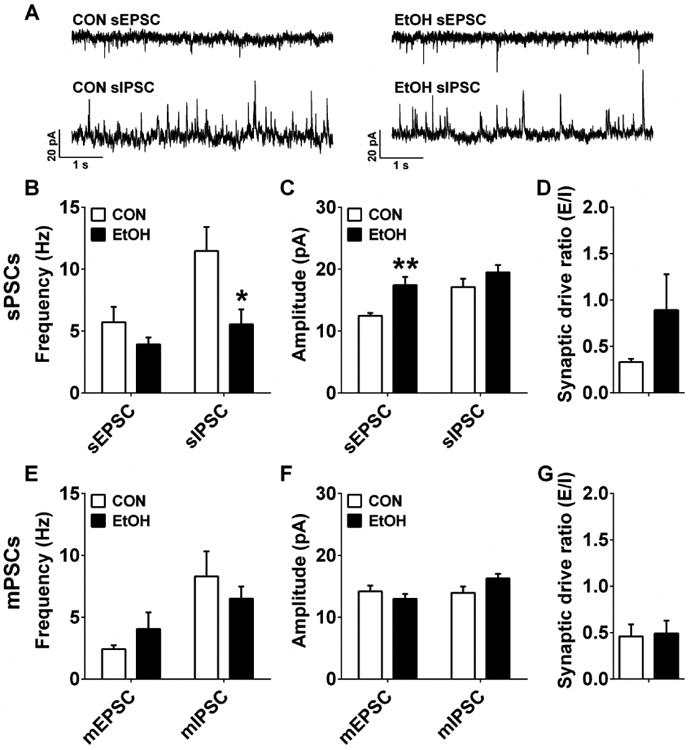
Synaptic transmission measures in the infralimbic cortex (ILC). A) Representative traces of sPSCs in the ILC of CON and EtOH mice. B) ILC neurons in EtOH mice (n=8) had significantly lower sIPSC, but not sEPSC, frequency than those in CON mice (n=10) (sEPSC: p > 0.20; sIPSC: t(16) = 2.45, *p = 0.026). C) ILC neurons in EtOH mice had significantly higher sEPSC, but not sIPSC, amplitude than those in CON mice (sEPSC: t(15) = 3.77, **p = 0.002; sIPSC: p > 0.20). D) There was no difference in sPSC synaptic drive ratio between CON and EtOH groups (p > 0.20). E-G) There were no differences in mEPSC or mIPSC frequency (E) or amplitude (F), nor in mPSC synaptic drive ratio (G) between CON (n=8) and EtOH (n=10) groups (p's > 0.05).