
Figure 5.
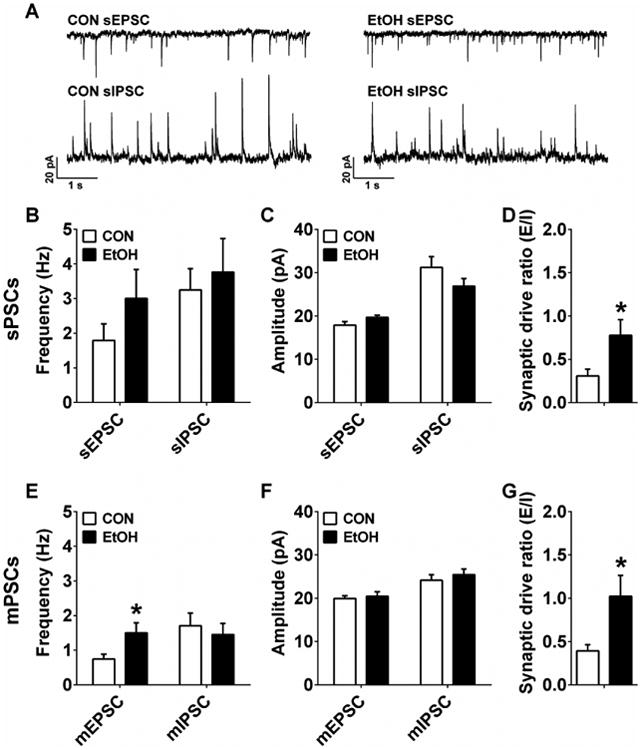
Synaptic transmission measures in the ventral BNST (vBNST). A) Representative traces of sPSC from CON and EtOH mice. B-D) There were no differences between vBNST neurons from CON (n=12) and EtOH (n=10) mice for sPSC frequency (B) or amplitude (C; p's > 0.05), but vBNST neurons in EtOH mice had greater synaptic drive ratios than those in CON mice (D; (t(18) = 3.28, *p = 0.029). E) mEPSC frequency was higher in vBNST neurons from EtOH (n=13) than CON (n=12) mice (t(22) = 3.28, *p = 0.026), but mIPSC frequency was not different (p > 0.60). F) There were no differences between groups in mEPSC or mIPSC amplitude (p's > 0.45). G) The mPSC synaptic drive ratio of vBNST neurons in EtOH mice was significantly higher than those in CON mice (t(19) = 2.41, *p = 0.026).