
Figure 6.
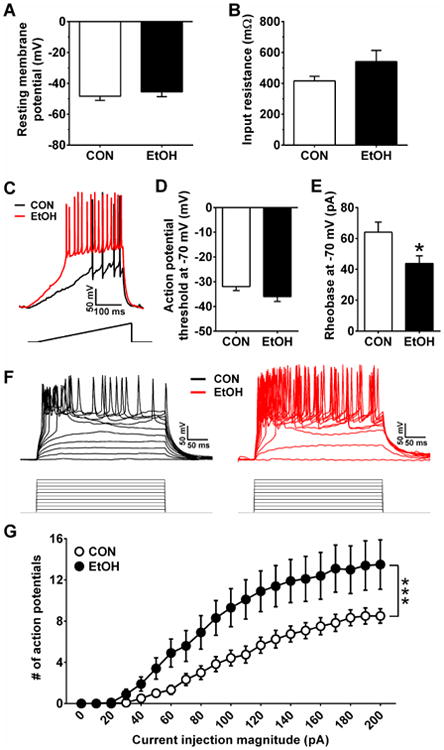
Excitability measures of neurons in the vBNST. A&B) There were no differences in the RMP (A) or Res (B) of vBNST neurons between CON (n=14) and EtOH (n=8) mice (p's > 0.10). C) Representative traces of current-injected firing from vBNST neurons in CON and EtOH mice when held at a common potential of -70 mV during a ramp protocol of 120 pA/1 s at RMP, with stimulus waveform depicted below traces. D&E) While there were no differences between groups in the action potential threshold of vBNST neurons when neurons were held at -70 mV (D; p > 0.10), neurons from EtOH mice had significantly lower rheobase than those from CON mice (E; t(22) = 2.45, *p = 0.023). F) Representative traces of current-injected firing from vBNST neurons in CON and EtOH mice when held at a common potential of -70 mV during a step protocol of increased current steps of 10 pA/250 ms step, with stimulus waveforms depicted below traces. G) Neurons from EtOH mice fired more action potentials per current injection step than neurons from CON mice in the V-I plot, indicated by a significant interaction between CIE and current injection magnitude (F(20,400) = 4.60, ***p < 0.0001).