
Figure 8.
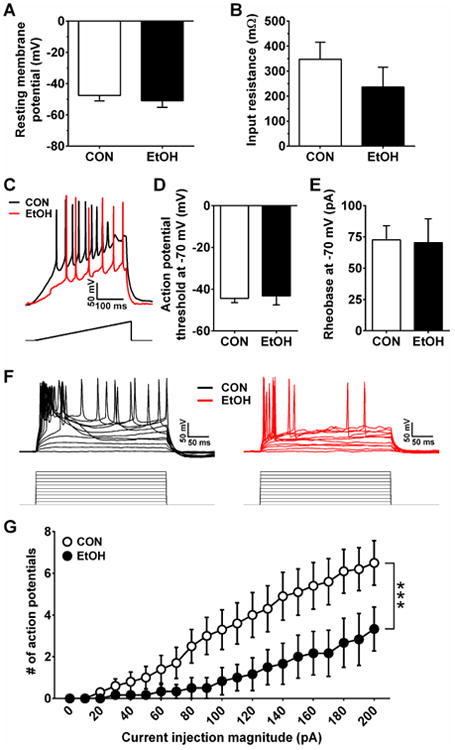
Excitability measures in the mCeA. A,B) There were no differences in the RMP (A) or Res (B) of mCeA neurons between CON (n=14) and EtOH (n=12) mice (p's > 0.35). C) Representative traces of current-injected firing from mCeA neurons in CON and EtOH mice when held at a common potential of -70 mV during a ramp protocol of 120 pA/1 s at RMP, with stimulus waveform depicted below traces. D,E) There were no differences between groups in the APT (D) or rheobase (E) when medial CeA neurons were held at -70 mV (p's > 0.75). F) Representative traces of current-injected firing from mCeA neurons in CON and EtOH mice when held at a common potential of -70 mV during a step protocol of increased current steps of 10 pA/250 ms step, with stimulus waveforms depicted below traces. G) CIE decreased the number of action potentials per current injection step, indicated by an interaction between CIE and current injection step (F(20,280) = 3.12, ***p < 0.0001).