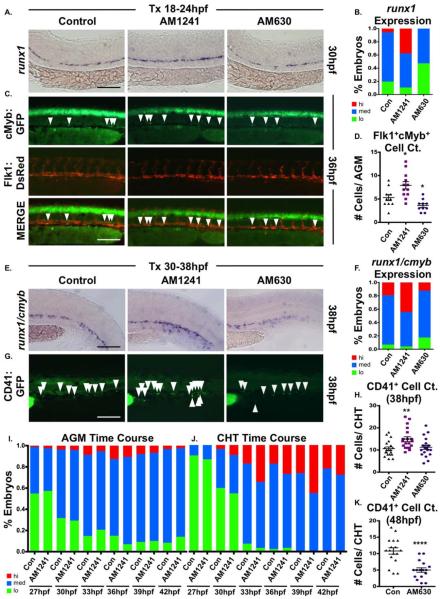
Figure 2.
CNR2 modulation impacts hematopoietic stem cell (HSC) development in the AGM and CHT. (A): Embryos exposed to AM1241 or AM630 (CNR2-selective antagonist, 10 μM each) during niche specification (18–24 hpf) exhibited increased or decreased runx1 expression in the AGM at 30 hpf, respectively (n≥55 per condition). (B): Qualitative phenotypic distribution of embryos from panel (A), scored with low, medium, or high runx1 expression in the AGM. (C): In vivo imaging confirmed the number of Flk1:dsRed+;cMyb:GFP+ HSCs (arrowheads) in the AGM was altered at 36 hpf following exposure (18–24 hpf) to AM1241 or AM630 (n≥10 per condition). (D): Absolute counts of Flk1:dsRed+cMyb:GFP+ HSCs from embryos in panel (C) (DMSO: 5.3±0.7, AM1241: 7.9±0.8, AM630: 3.6±0.4; *, p≤.05, two-tailed t test). (E): Embryos exposed to CNR-modifiers during the phase of HSC production (30–38 hpf) exhibited altered runx1;cmyb+ expression in the CHT (scored as the vascular region beyond the tip of the yolk sac extension) at 38 hpf (n≥55 per condition). (F): Qualitative phenotypic distribution of embryos from panel (E), scored with low, medium, or high runx1;cmyb expression in the CHT. (G): In vivo imaging of cd41:egfp embryos indicated the number of CD41+ HSCs (arrowheads) was increased in the CHT at 38 hpf following exposure to AM1241 but not significantly altered in embryos exposed to AM630 (n≥20 per condition). (H): Absolute counts of CD41:GFP+ cells from embryos in panel (G) (DMSO: 10.6±0.8, AM1241: 15.0±1.1, AM630: 11.3±0.9; **, p≤.01, two-tailed t test). (I): Time course analysis of the qualitative phenotypic distribution of runx1;cmyb expression in the AGM region of embryos exposed to AM1241 during the phase of HSC production (24 hpf until time indicated) (n≥55 per condition). (J): Time course analysis of the qualitative phenotypic distribution of runx1;cmyb expression in the CHT region as described for panel (I), showing increased colonization in response to AM1241 compared to wild type sibling controls (see also Supporting Information Fig. S2E). (K): Embryos exposed to AM630 during HSC production (30–48 hpf) had decreased numbers of CD41+ HSCs at 48 hpf (DMSO: 11.6±0.6, AM630: 7.2±0.6; ****, p≤.0001, two-tailed t test; see also Supporting Information Fig. S2F). Scale bars (A, C, E, G)=100 μm. Abbreviations: AGM, aorta-gonad-mesonephros; CHT, caudal hematopoietic tissue.

