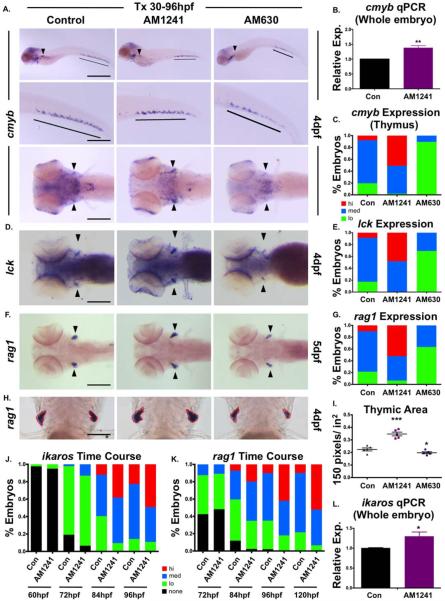
Figure 3.
CNR2 modulation impacts hematopoietic stem and progenitor cell colonization of thymus. (A): Exposure to CNR2-modulators (30–96 hpf) during the window of hematopoietic stem cell (HSC) expansion and secondary niche colonization affected cmyb+ expression (upper row, lateral view; line, caudal hematopoietic tissue (CHT) region; arrowhead, kidney marrow; middle row, close up of CHT; lower row, dorsal view; arrowheads, thymi) with AM1241 increasing thymic colonization, and AM630 decreasing expression in all hematopoietic sites (n>45 per condition). (B): qPCR analysis indicated AM1241-treatment (30–96 hpf) increased total cmyb expression at 4 dpf (n=4, AM1241: 1.38±0.07-fold; p≤.01, two-tailed t test). (C): Qualitative phenotypic distribution of low, medium, or high thymic cmyb expression from embryos exposed to AM1241 and AM630 (30–96 hpf) as in panel (A). (D): Embryos exposed to AM1241 and AM630 during HSC expansion as in panel (A) showed an altered thymic expression of lck (n>20 per condition). (E): Qualitative phenotypic distribution of embryos from panel (D), scored with low, medium, or high lck expression in the thymus. (F): Embryos exposed to AM1241 and AM630 as in panel (A) showed increased or decreased thymic expression of rag1, respectively (n>45 per condition). (G): Qualitative phenotypic distribution of embryos from panel (F), scored with low, medium, or high rag1 expression in the thymus. (H): Representative examples of total thymic area measurements (outlined in red) in AM1241- or AM630-exposed embryos (30–96 hpf) following rag1 whole mount in situ hybridization. (I): Bar graph of total thymic area from panel (H) (DMSO: 0.224±0.012 a.u., AM1241: 0.347±0.015, AM630: 0.197±0.008; *, p≤.05; ***, p≤.001, one-tailed t test, n=5). (J): Time course analysis (60–96 hpf) of the qualitative phenotypic distribution of ikaros expression in the thymus as described for panel (A), showing increased colonization in response to AM1241 compared to wild type sibling controls (n≥40). (K): Time course analysis (72–120 hpf) of the qualitative phenotypic distribution of rag1 expression in the thymus as described for panel (A), indicating increased lymphoid commitment in response to AM1241 compared to controls (n≥40). (L): qPCR confirmation of increase ikaros expression at 4 dpf in embryos exposed to AM1241 during HSC expansion and niche colonization (30–96 hpf) (AM1241: 1.30±0.11-fold, p≥.05; *, p≤.05, two-tailed t test, n=3). Scale bars (A, top)=800 μm, (A, middle)=400 μm, (A, bottom), (D, F)=200 μm, (H)=100 μm. Abbreviation: qPCR, quantitative polymerase chain reaction.

