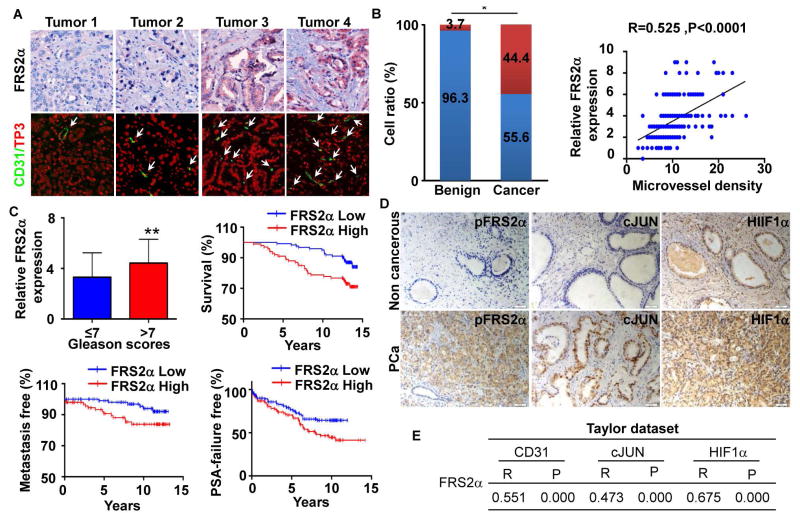
Fig. 1. Expression and activation of Frs2α in human PCa.
A. Representative images of immunochemical staining of FRS2α and CD31 counterstained with nuclear To-Pro3 (TP3) in the MGH PCa TMA. B. Statistical comparison of differences in expression of FRS2α in human PCa and benign prostate (a) and Pearson correlation between FRS2α expression and microvessel density determined by CD31 staining (b). Red bar, FRS2α expression score>3; blue bar, FRS2α expression score≤3. C. Statistical analyses of the association of FRS2α expression with Gleason scores and survival time of the patients. D. Representative images of FRS2α phosphorylation and expression of the indicated molecules in PCa TMA (from Shanghai Outdo Biotech Co, LTD). E. Statistical analyses of the association between Frs2α and CD31, cJun, or Hif1a expression at the mRNA level in the Taylor dataset. R, Pearson correlation coefficient; P, p value; *, P<0.05

