
Figure 12.
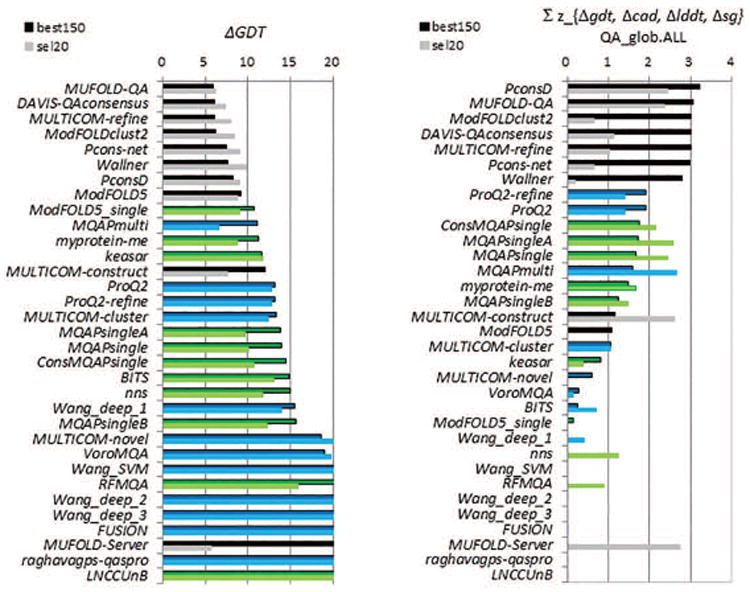
(A) Average deviations of accuracy estimates from GDT_TS scores of the assessed models. For each group, the deviations are calculated for each model and then averaged over all predicted models. Lower scores indicate better group performance. (B) Cumulative z-scores of the deviations of absolute accuracy estimates for the CASP11 groups. Z-scores for each of the four evaluation measures (GDT_TS, LDDT, CADaa, and SG) are calculated from the distributions of the corresponding average errors and then added. The higher the score, the better the group performance. Data bars are shown only for groups with above the average performance. In both panels, graphs show the results for two datasets: best150 (upper bars, darker color) and sel20 (lower bars, lighter color). Clustering methods are in black, single-model methods in blue and quasi-single model methods in green. Groups are sorted according to the results on the best150 datasets. The best performing methods are capable of predicting the absolute accuracy of models with an average per-target error of 6 GDT_TS.