
Figure 8.
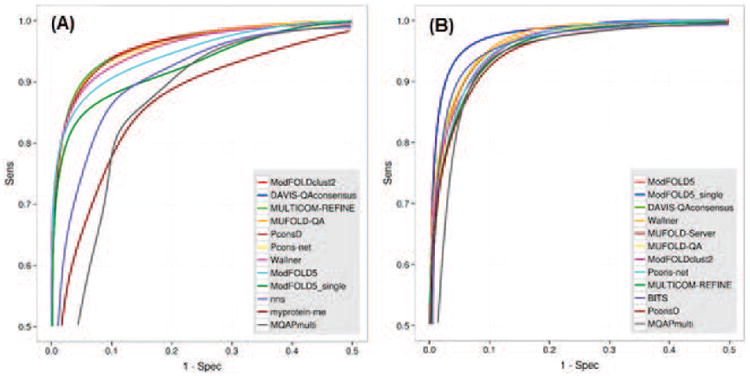
ROC curves for the best performing EMA groups according to the GDT_TS score on (A) best150 and (B) sel20 datasets. The separation threshold between good and bad models is set to GDT_TS=50. Group names are ordered according to decreasing AUC scores. The data are shown for the best 12 groups only. For clarity, only the left upper quarters of ROC curves are shown (FPR≤0.5, TPR≥0.5). Top performing groups show similar discriminatory power with clustering methods and perform slightly better than single-model methods.