Abstract
Fluorescent nanocrystals, specifically quantum dots, have been a useful tool for many biomedical applications. For successful use in biological systems, quantum dots should be highly fluorescent and small/monodisperse in size. While commonly used cadmium-based quantum dots possess these qualities, they are potentially toxic due to the possible release of Cd2+ ions through nanoparticle degradation. Indium-based quantum dots, specifically InP/ZnS, have recently been explored as a viable alternative to cadmium-based quantum dots due to their relatively similar fluorescence characteristics and size. The synthesis presented here uses standard hot-injection techniques for effective nanoparticle growth; however, nanoparticle properties such as size, emission wavelength, and emission intensity can drastically change due to small changes in the reaction conditions. Therefore, reaction conditions such temperature, reaction duration, and precursor concentration should be maintained precisely to yield reproducible products. Because quantum dots are not inherently soluble in aqueous solutions, they must also undergo surface modification to impart solubility in water. In this protocol, an amphiphilic polymer is used to interact with both hydrophobic ligands on the quantum dot surface and bulk solvent water molecules. Here, a detailed protocol is provided for the synthesis of highly fluorescent InP/ZnS quantum dots that are suitable for use in biomedical applications.
Keywords: Chemistry, Issue 108, Quantum dots, Synthesis, Indium Phosphide, Cellular Imaging, Nanoparticles, Fluorescence
Introduction
Quantum dots (QDs) are semiconducting nanocrystals that exhibit fluorescent properties when irradiated with light1. Due to their small size (2-5 nm), which is similar to many larger biomolecules, and ease of biofunctionalization, QDs are an extremely attractive tool for biomedical applications. They have found use in biological labeling, single-molecule live-cell imaging, drug delivery, in vivo imaging, pathogen detection, and cell tracking, among many other uses2-8.
Cd-based QDs have been most commonly used in biomedical applications because of their intense fluorescence and narrow emission peak widths9. However, concerns have been raised due to potential toxicity of Cd2+ ions10 that may be released through degradation of the nanoparticle. Recently, InP-based QDs have been explored as an alternative to Cd-based QDs because they maintain many fluorescence characteristics of Cd-based QDs and may be more biocompatible11. Cd-based QDs have been found to be significantly more toxic than InP-based QDs in in vitro assays at concentrations as low as 10 pM, after only 48 hr11.
The fluorescence emission color of QDs is size-tunable1. That is, as the size of the QD increases, the fluorescence emission is red-shifted. The size and size dispersity of the QD products can be modified by changing the temperature, reaction duration, or precursor concentration conditions during the reaction12. While the emission peak of InP QDs is typically broader and less intense than Cd-based QDs, InP QDs can be made in a large variety of colors designed to avoid spectral overlap, and are sufficiently intense for most biomedical applications12. The synthesis detailed in this protocol yields QDs with a red emission peak centered at 600 nm.
Several steps are taken after synthesis of the QD cores to maintain the optical integrity of the QDs and to make them compatible for biological applications. The surface of the QD core must be protected from oxidation or surface defects that may cause quenching; therefore, a ZnS shell is coated over the core to produce InP/ZnS (core/shell) QDs13. This coating has been shown to protect the photoluminescence of the QD product. The presence of zinc ions during InP QD synthesis has been shown to limit surface defects, as well as decrease size distribution12. Even with the presence of Zn2+ in the reaction medium, synthesis of InZnP are highly unlikely12. After coating, resulting InP/ZnS QDs are coated in hydrophobic ligands such as trioctylphosphine oxide (TOPO) or oleylamine12,14. An amphiphilic polymer can interact with hydrophobic ligands on the QD surface as well as bulk water molecules to impart water solubility15. Amphiphilic polymers with carboxylate chemical groups can be used as "chemical handles" to further functionalize the QDs.
This protocol details the synthesis and functionalization of water-soluble InP/ZnS QDs with very intense fluorescence emission and relatively small size-dispersity. These QDs are potentially less toxic than commonly used CdSe/ZnS QDs. Herein, the synthesis of InP/ZnS QDs provides a practical alternative to Cd-based QDs for biomedical applications.
Protocol
1. Synthesis of Indium Phosphide/Zinc Sulfide (InP/ZnS) Quantum Dots
- Synthesis of Indium Phosphide (InP) Quantum Dot Cores
- Fit a 100 ml round bottom, 3-neck, flask with a 12-inch condenser. Add 30 ml oleylamine (OLA), 0.398 g indium (III) chloride (InCl3), 0.245 g zinc (II) chloride (ZnCl2) and stir while evacuating at RT using a vacuum for 1 hr. The solution should appear colorless with a white precipitate.
- Using a heating mantle with a thermocouple and proportional-integral-derivative (PID) temperature controller, increase the temperature of the solution to 120 °C. Evacuate the solution under vacuum for 20 min to remove low boiling point impurities that may affect core growth. Note: While it is possible to use a sand bath and thermometer, using a heating mantle and PID increases the uniformity and reproducibility of the reaction products.
- Under inert gas (e.g., N2), reflux the solution and increase the temperature to 220 °C for 15 min. The InCl3 and ZnCl2 completely dissolve, resulting in a pale yellow solution. Allow the temperature to stabilize for 10 min.
- Purge a disposable, 3 ml plastic syringe and 4 inch, 22 G needle with nitrogen gas. Using the syringe, quickly deliver 0.5 ml tris(dimethylamino)phosphine (TDMAP) to the InCl3 solution. The solution temperature decreases slightly and returns to 220 °C. The solution changes from transparent, pale yellow to opaque, black.
- After 9.5 min, remove the reaction flask from the heating mantle until the temperature decreases below 200 °C. To protect the integrity of the InP cores, proceed directly to the ZnS coating in step 1.2.1.
- Synthesis of Zinc Sulfide (ZnS) Quantum Dot Shells
- Place the reaction flask from step 1.1.5 on a heating mantle and stabilize the temperature at 200 °C. Slowly add 3.58 g dodecanethiol (DDT) over the course of 15 sec to the solution containing InP QDs. Allow the solution to react for 1 hr. Note: ZnS shell thickness can be varied by increasing or decreasing the amount of zinc stearate added in step 1.2.4. Altering the amount of ZnCl2 or dodecanethiol in steps 1.1.1 and 1.2.1 can significantly impact the quality of QDs by changing the reaction kinetics.
- Afterward, remove the reaction flask from the heating mantle and allow the solution to cool to approximately 60 °C.
- Once the InP/ZnS solution reaches ~60 °C, add 10 ml hexanes and transfer the entire solution of roughly 45 ml to a 50 ml polypropylene centrifuge tube. Centrifuge the sample (3,000 x g for 10 min) to remove unreacted solid precursors.
- Carefully transfer the supernatant to a 250 ml polypropylene centrifuge bottle, add 200 ml acetone, and centrifuge the solution (3,000 x g for 10 min) to precipitate InP/ZnS QDs. This volume can also be split evenly into four 50 ml tubes for centrifugation if a centrifuge with the necessary rotor/accessories is not available. Decant the supernatant and dry the QD pellet thoroughly with nitrogen gas to remove acetone.
- Resuspend the QDs in 20 ml OLA using sonication, transfer to a 50 ml round bottom, 3-neck, flask containing 0.474 g zinc stearate, and stir. Evacuate the solution under vacuum for 20 min at RT.
- Under nitrogen gas, increase the temperature to 180 °C and allow the reaction to proceed for 3 hr. While there are no noticeable visual changes to the reaction solution that occur during this reaction, adding zinc stearate increases ZnS shell thickness, thus increasing QY by improving surface passivation of QDs12.. Once the reaction is complete, remove the flask from the heating mantle and allow the solution to cool to approximately 60 °C.
- Once the InP/ZnS solution reaches ~60 °C, add 20 ml hexanes and transfer to a 50 ml polypropylene centrifuge tube. Centrifuge the sample (3,000 x g for 10 min) to remove unreacted zinc stearate.
- Carefully transfer the supernatant to a 250 ml polypropylene centrifuge bottle, add 200 ml acetone, and centrifuge the solution (3,000 x g for 10 min) to precipitate InP/ZnS QDs. Carefully decant the supernatant and thoroughly dry with nitrogen gas to remove acetone.
- Dissolve the InP/ZnS QD pellet in 30 ml hexane. Vortex and sonicate the solution briefly to ensure complete dispersion.
- Repeat purification steps 1.2.6-1.2.8 two more times to ensure thorough removal of excess organic ligands. Interactions between the amphiphilic polymer and the QD in step 1.2 can be compromised in the presence of excess ligands.
- With calculations detailed by Xie, et al.16, determine the size and concentration of the synthesized InP/ZnS QDs using UV-Vis Spectroscopy. Note: The important spectral characteristic for this analysis is the shoulder of the absorption peak. The wavelength and absorbance value of the maximum of this shoulder is used to calculate the size and the concentration of the QDs, respectively. This reaction typically yields approximately 5 μmol of QDs with an emission peak at 600 nm. To synthesize QDs of different colors, the duration and/or temperature of the reaction can be changed. A longer reaction time and/or higher temperature of the solution results in a red-shifted emission peak. For example, increasing the reaction temperature to 240 °C and maintaining reaction time of 10 min will result in QDs with a 680 nm maximum emissions peak. Likewise, reducing reaction time to 2 min and doubling zinc chloride used will result in QDs with a 470 nm maximum emission peak. These InP/ZnS QDs are stable for at least one month at 4 °C in the dark under inert gas.
2. Water Solubilization of InP/ZnS Quantum Dots Using an Amphiphilic Polymer
- Water Solubilization
- Using the InP/ZnS QDs from step 1.2.10, dilute a portion of the QDs with hexanes to obtain 1 ml of 1 μM QDs.
- In a centrifuge tube, transfer 0.25 ml InP/ZnS QDs into each tube. Add 1 ml acetone or methanol to the centrifuge tube and centrifuge (3,000 x g for 10 min). Carefully remove the supernatant and dissolve each precipitate in 1 ml tetrahydrofuran (THF).
- Transfer the InP/ZnS QDs dissolved in THF into a 100 ml round bottom flask and dilute with 16 ml THF. To reduce the number of aggregates in solution, sonicate the QDs for 5-10 min.
- Dissolve 30 mg poly(maleic andhydride-alt-1-octadecene), 3-(dimethylamino)-1-propylamine (PMAL-d) in 10 ml molecular grade water. Water bath sonication or gentle stirring until the solution is translucent is sufficient to completely dissolve the polymer. The use of vortex or vigorous stirring can produce many bubbles, which hinders interaction of the polymer with the QD. Add the 10 ml polymer solution to the 100 ml round bottom flask containing InP/ZnS QDs in THF.
- Evaporate THF from the QD/polymer solution using a rotary evaporator. Place the flask in an ice bath while evaporating to facilitate the interaction between the polymer and QD. Depending on the strength of the vacuum, most THF is evaporated after 10 min and the solution appears turbid.
- Once the solution is evaporated to 10 ml, remove the flask from the rotary evaporator and add 30 ml molecular grade water. Return the flask to the rotary evaporator and continue to evaporate to 2 ml. This final evaporation step may take many hours; ensure the ice bath is maintained.
- Remove the water-soluble InP/ZnS QDs from the round bottom flask with a pipette. Filter the QD solution using a 3 ml plastic syringe attached to a 0.1 μm nylon syringe filter into a 5 ml centrifuge tube.
- Place the QDs into a 20,000 MWCO membrane dialysis unit and dialyze against 0.05 M borate buffer pH 8.5 to remove excess polymer. (Slowly add 0.05 M sodium tetraborate decahydrate to 0.05 M boric acid, with vigorous stirring, until the pH is 8.5 to make this borate buffer solution.) Using a vacuum concentrator, concentrate the QDs in borate buffer to 1 ml.
- For storage, purge the solution with nitrogen gas before sealing with Parafilm. The water-soluble InP/ZnS QDs are stable for at least 4 months at 4 °C in the dark.
Representative Results
The uncoated InP cores do not demonstrate substantial visible fluorescence by eye. However, InP/ZnS (core/shell) quantum dots appear to fluoresce brightly by eye under UV irradiation. The fluorescence of InP/ZnS QDs was characterized using fluorescence spectroscopy. The fluorescence spectrum of QDs in hexanes (Figure 1) excited at 533 nm demonstrates one major peak centered at 600 nm with a full width at half maximum (FWHM) of 73 nm. While absorbance (0.2) offset in Figure 1 could imply QDs scattering light, and thus the presence of aggregated QDs, blinking analysis (vide infra) indicate that most QDs are single, or very small groups, of QDs. After coating with the amphiphilic polymer PMAL-d, the quantum yield of InP/ZnS QDs was investigated by comparing the integrated fluorescence intensity of the QDs with Rhodamine B as a standard17. The quantum yield of QDs in hexanes was determined to be 7.96% on average (2 measurements, 7.69% and 8.22%) and 6.03% in water on average (2 measurements, 5.98% and 6.08%).
The size of water-soluble InP/ZnS QDs was characterized using both transmission electron microscopy (TEM) and dynamic light scattering (DLS). TEM images, which only visualize the nanocrystal core and shell (InP/ZnS), not organic ligands on the surface, were captured at a nominal magnification of 150,000X. The images were analyzed using Fiji ImageJ18 and the threshold was adjusted to give binary images. The minimum and maximum Feret's diameters were averaged to determine the diameters of these water-soluble QDs. This data demonstrated small, relatively monodisperse QDs with an average diameter of 2.74 ± 0.72 nm (Figures 2A & B). The effective hydrodynamic diameter of the QDs in water at pH 7, encapsulated in PMAL-d, was measured from using DLS. It should be noted that the effective hydrodynamic diameter via DLS measures the solvated QD, including organic ligands and polymers on the surface of the QD, as well as water molecules that interact with them. Therefore, DLS measurements are generally much larger than measurements obtained in TEM experiments. In this measurement, QDs were assumed to be spherical and a total of 30 measurements were captured to calculate the effective diameter by volume using BIC Partial Solutions software. These values were averaged, providing an average diameter of 14.8 ± 6.0 nm (Figure 2C).
In order to determine if the synthesized InP/ZnS QDs were suitable for single-molecule imaging, blinking analysis was performed using epifluorescence microscopy8. While it is not possible to see individual QDs using light microscopy, the analysis of "on" and "off" fluorescence emission states can be used to identify single QDs puncta in fluorescence images. A puncta representing a single blinking quantum dot exhibits an "on" state that is differentiated from the "off" state. A movie of blinking QDs (diluted to approximately 100 pM in deionized water) was captured using a 63X, 1.4 NA, oil-immersion objective fitted onto an epifluorescence microscope with an appropriate filter cube and CCD camera. Images were captured with 30 msec exposure consecutively for 500 frames. Blinking analysis was performed by analyzing the average intensity of a single puncta (approximately 4 pixels) in each frame using ImageJ19 (Figure 3A). The distinct gap in between the "on" and "off" states of our QDs show their potential for single-molecule imaging (Figure 3B).
The interaction of the InP/ZnS QDs with cells was also investigated through both toxicity and cellular internalization. For both studies, mouse neuroblastoma (N2a) cells were used and all experiments were carried out in cellular medium (50/50 D-MEM/Opti-MEM supplemented with 10% fetal bovine serum and antibiotic/antimycotic). A trypan blue toxicity assay20 was performed by incubating N2a cells for 24 and 48 hr with varying concentrations of QDs. The results demonstrate negligible toxicity of N2a cells at QD concentrations between 1-5 nM (Figure 4). To observe QD internalization, N2a cells were incubated with water-soluble InP/ZnS QDs for 12 hr at both 5 and 10 nM. Images of cells incubated with these QDs appears to demonstrate a lysosomal localization of QDs after 12 hr (Figure 5), which is consistent with other internalization results of nanoparticles21.
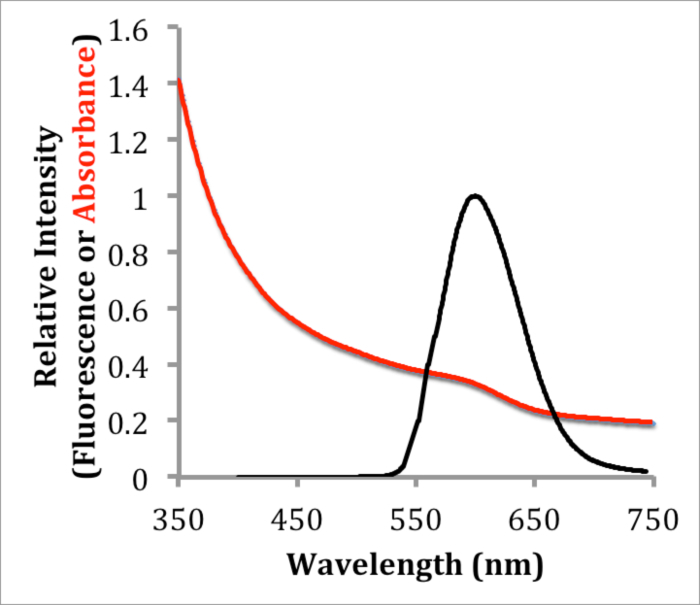 Figure 1. Absorbance and Fluorescence Characterization of InP/ZnS QDs. Absorbance and corrected fluorescence emission spectra of InP/ZnS in hexanes excited at 533 nm, showing a maximum absorbance at 600 nm and a FWHM of 73 nm. Please click here to view a larger version of this figure.
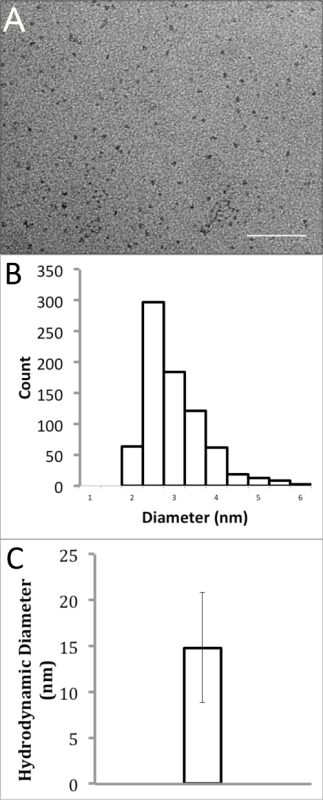 Figure 2. Size Analysis of Polymer-coated InP/ZnS QDs in Water. (A) Transmission electron micrograph of InP/ZnS QDs dissolved in water (scale bar = 50 nm). (B) Particle size distribution histogram of TEM results with an average diameter of 2.74 ± 0.72 nm. (C) Dynamic light scattering analysis of InP/ZnS QDs in water, showing an average hydrodynamic diameter of 14.8 ± 6.0 nm. Please click here to view a larger version of this figure.
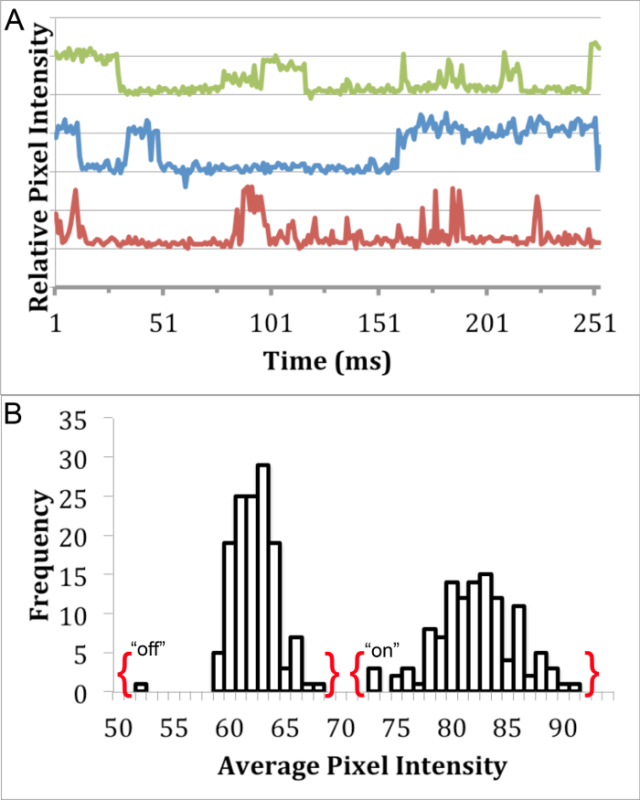 Figure 3. Blinking Analysis of InP/ZnS QDs. Single fluorescent puncta analysis detailing the presence of distinct "on" and "off" states through (A) a blinking profile of InP/ZnS QDs in water using 460 nm ± 25 nm excitation filter, 500 nm long pass emission filter, and 475 nm dichroic mirror, and (B) a histogram exhibiting the bimodal distribution of pixel intensity from one QD blinking profile. Please click here to view a larger version of this figure.
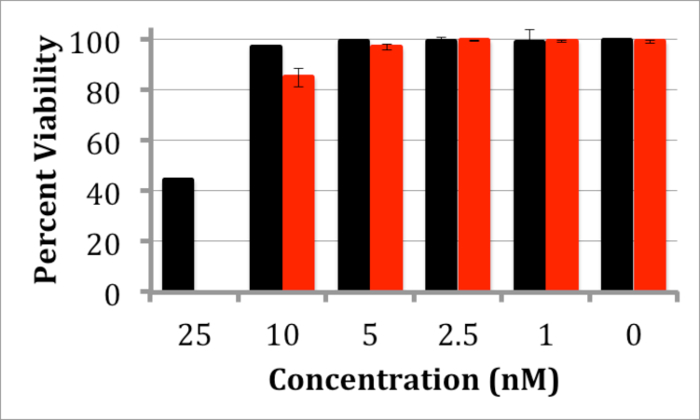 Figure 4. Trypan Blue Toxicity Assay of N2a Cells Treated with InP/ZnS QDs. Graph depicting the viability of N2a cells after incubation with InP/ZnS QDs for 24 (black) or 48 hr (red) with 1 - 25 nM QDs. Negligible toxicity is observed below 5 nM. Error bars are based on standard deviation of viability in 3 different measurements. Please click here to view a larger version of this figure.
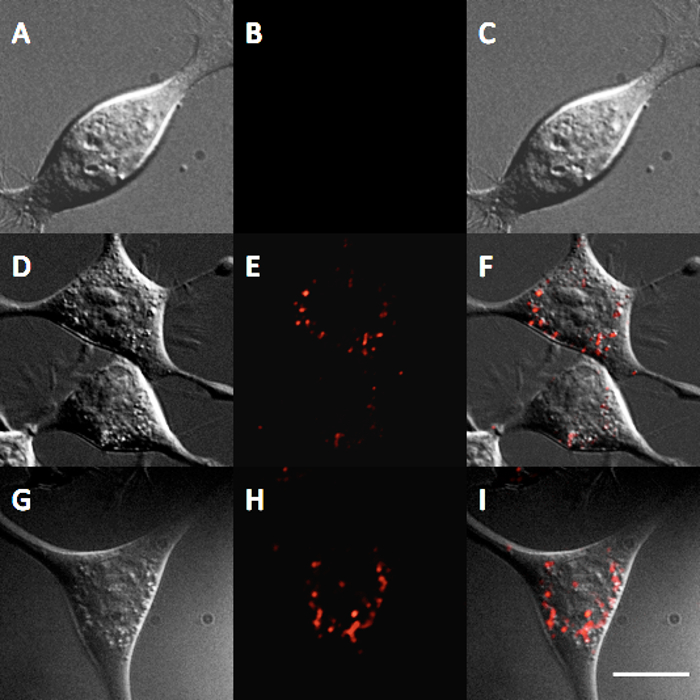 Figure 5. Internalization of InP/ZnS QDs in N2a cells. Fluorescence micrograph showing the internalization of InP/ZnS QDs after 12 hr of incubation with 0 nM control (A) DIC (B) QD, and (C) overlay, after 12 hr of incubation with 5 nM QDs (D) DIC (E) QD, and (F) overlay, and after 12 hr of incubation with 10 nM QDs (G) DIC (H) QD, and (I) overlay. Scale bar = 10 μm. Please click here to view a larger version of this figure.
Discussion
This protocol details the synthesis of highly fluorescent InP/ZnS QDs that can be used in many biological systems. The QD products synthesized here exhibited a single fluorescence emission peak centered at 600 nm with a FWHM of 73 nm (Figure 1), which is comparable to other previously described syntheses12. Reaction time and reaction temperature are extremely crucial steps due to their profound effect on QD synthesis quality and repeatability. After solubilization in water, the QDs were determined to have a quantum yield of approximately 6%. Variation of the reaction time, temperature, or precursor concentration allows the tuning of QD size and emission wavelength, which may be used in multi-spectral applications.
Size and surface charge are extremely important factors to consider when using nanoparticles in biological systems. To minimize disturbance of target biomolecules, QDs should maintain a small, monodisperse size. Additionally, the surface charge of QDs in solution can be modified to decrease nonspecific binding towards unintended targets. The synthesis of QDs presented here produced QDs with a diameter of 2.74 ± 0.72 nm by TEM (only the core and shell are visible) (Figures 2A and 2B). Water-soluble QDs were found to have an effective hydrodynamic diameter of 14.8 ± 6.0 nm, which is comparable to Cd-based QDs currently used for biological studies22. The surface charge and functionality of aqueous QDs can be modified by further reaction of the carboxylate chemical groups of the amphiphilic polymer.
Blinking analysis was used to explore the suitability of these InP/ZnS for single-molecule imaging studies. Since it is not possible to visualize individual QDs using light microscopy, the blinking of individual QDs can be used to identify single particles. This blinking phenomenon is the alternation between of discrete "on" and "off" fluorescence states23, which can be investigated using the average pixel intensity of single fluorescent QD puncta over time. The fluorescence traces of InP/ZnS QD puncta demonstrate characteristic "on" and "off" states (Figure 3A). Moreover, there is no overlap between the "on" and "off" states of a single puncta (Figure 3B), which has been used in previous studies to distinguish single particles8.
Further experiments were used to explore the suitability of these InP/ZnS QDs for cellular studies. A trypan blue toxicity assay was performed to assess the biocompatibility of the InP/ZnS QDs. After incubation for 24 hours up to 48 hr at QD concentrations ranging from 1-5 nM, negligible toxicity was observed (Figure 4), which is comparable to toxicity studies for InP/ZnS QDs11. Substantial toxicity was not observed below 25 nM; this concentration is much higher than required for many biomedical applications. For example, single-molecule imaging studies often require pM concentrations of the QD probe to label a representative number of surface-bound cellular receptors24. Additionally, N2a cells incubated with QDs at 5 nM or 10 nM for 12 hr in cellular media indicate that QDs are internalized via endocytosis, i.e., QDs demonstrate a punctate staining pattern within the cells (Figure 5). These results indicate the suitability of these InP/ZnS QDs for investigating cellular processes.
This protocol details the synthesis and functionalization of water soluble InP/ZnS QDs with intense fluorescence emission, relatively small size-dispersity, and biological compatibility. The high quality of these QD products is indicated by the visualization of single QDs in fluorescence microscopy, which demonstrates that they are suitable for single-molecule imaging. It is anticipated that these Cd-free QDs are potentially much less toxic to the biological systems studied, as well as the researchers studying them. As such, the use of these In-based QDs for biomedical applications is a prudent alternative to Cd-based QDs.
Disclosures
The authors have nothing to disclose.
Acknowledgments
The authors gratefully acknowledge the Department of Chemistry and the Graduate College at Missouri State University for their support of this project. We also acknowledge the Electron Microscopy Laboratory at the Frederick National Laboratory for Cancer Research for use of their transmission electron microscope and carbon-coated grids.
References
- Alivisatos AP. Semicondictor clusters, nanocrystals, and quantum dots. Science. 1996;271(5251):933–937. [Google Scholar]
- Michalet X, et al. Quantum dots for live cells, in vivo imaging, and diagnostics. Science. 2005;307(5709):538–544. doi: 10.1126/science.1104274. [DOI] [PMC free article] [PubMed] [Google Scholar]
- Jaiswal JK, Mattoussi H, Mauro JM, Simon SM. Long-term multiple color imaging of live cells using quantum dot bioconjugates. Nat. Biotechnol. 2009;21(1):47–51. doi: 10.1038/nbt767. [DOI] [PubMed] [Google Scholar]
- Deerinck TJ. The application of fluorescent quantum dots to confocal, multiphoton, and electron microscopic imaging. Toxicol. Pathol. 2008;36(1):112–116. doi: 10.1177/0192623307310950. [DOI] [PMC free article] [PubMed] [Google Scholar]
- Smith AM, Duan H, Mohs AM, Nie S. Bioconjugated quantum dots for in vivo molecular and cellular imaging. Adv. Drug Deliv. Rev. 2008;60(11):1226–1240. doi: 10.1016/j.addr.2008.03.015. [DOI] [PMC free article] [PubMed] [Google Scholar]
- Jamieson T, et al. Biological applications of quantum dots. Biomaterials. 2007;28(31):4717–4732. doi: 10.1016/j.biomaterials.2007.07.014. [DOI] [PubMed] [Google Scholar]
- Lidke DS, Arndt-Jovin DJ. Imaging takes a quantum leap. Physiology. 2004;19:322–325. doi: 10.1152/physiol.00030.2004. [DOI] [PubMed] [Google Scholar]
- Fichter KM, Flajolet M, Greengard P, Vu TQ. Kinetics of G-protein-couple receptor endosomal trafficking pathways revealed by single quantum dots. Proc. Natl. Acad. Sci. U.S.A. 2010;107(43):18658–18663. doi: 10.1073/pnas.1013763107. [DOI] [PMC free article] [PubMed] [Google Scholar]
- Smith AM, Ruan G, Rhyner MN, Nie S. Engineering luminescent quantum dots for in vitro molecular and cellular imaging. Ann. Biomed. Eng. 2006;34(1):3–14. doi: 10.1007/s10439-005-9000-9. [DOI] [PubMed] [Google Scholar]
- Derfus AM, Chan WCW, Bhatia SN. Probing the cytotoxicity of semiconductor quantum dots. Nano Lett. 2004;4(1):11–18. doi: 10.1021/nl0347334. [DOI] [PMC free article] [PubMed] [Google Scholar]
- Brunetti V, et al. InP/ZnS as a safer alternative to CdSe/ZnS core/shell quantum dots: in vitro and in vivo toxicity assessment. Nanoscale. 2013;5(1):307–317. doi: 10.1039/c2nr33024e. [DOI] [PubMed] [Google Scholar]
- Song W, et al. Amine-derived synthetic approach to color-tunable InP/ZnS quantum dots with high fluorescent qualities. J. Nanopart. Res. 1750;15(1750) [Google Scholar]
- Dabbousi BO, et al. (CdSe)ZnS core-shell quantum dots: Synthesis and characterization of a size series of highly luminescent nanocrystallites. J. Phys. Chem. B. 1997;101(46):9463–9475. [Google Scholar]
- Micic OI, Curtis CJ, Jones KM, Sprague JR, Nozik AJ. Synthesis and characterization of InP quantum dots. J. Phys. Chem. 1994;98(19):4966–4969. [Google Scholar]
- Qi L, Gao X. Quantum dot-amphipol nanocomplex for intracellular delivery and realtime imaging of siRNA. ACS Nano. 2008;2(7):1403–1410. doi: 10.1021/nn800280r. [DOI] [PMC free article] [PubMed] [Google Scholar]
- Xie R, Zheng L, Peng X. Nucleation kinetics vs chemical kinetics in the initial formation of semiconductor nanocrystals. J. Am. Chem. Soc. 2009;131(42):15457–15466. doi: 10.1021/ja9063102. [DOI] [PubMed] [Google Scholar]
- Williams ATR, Winfield SA, Miller JN. Relative fluorescence quantum yields using a computer-controlled luminescence spectrometer. Analyst. 1983;108:1067–1071. [Google Scholar]
- Schindelin J, et al. Fiji: An open-source platform for biological-image analysis. Nat. Methods. 2012;9(7):676–682. doi: 10.1038/nmeth.2019. [DOI] [PMC free article] [PubMed] [Google Scholar]
- Schnieder CA, Rasband WS, Eliceiri KW. NIH image to ImageJ: 25 years of image analysis. Nat. Methods. 2012;9:671–675. doi: 10.1038/nmeth.2089. [DOI] [PMC free article] [PubMed] [Google Scholar]
- Jin Y, Kannan S, Wu M, Zhao JX. Toxicity of luminescent silica nanoparticles to living cells. Chem. Res. Toxicol. 2007;20(8):1126–1133. doi: 10.1021/tx7001959. [DOI] [PubMed] [Google Scholar]
- Corazzari I, Gilardino A, Dalmazzo S, Fubini B, Lovisolo D. Localization of CdSe/ZnS quantum dots in the lysosomal acidic compartment of cultured neurons and its impact on viability: potential role of ion release. Toxicol. In Vitro. 2013;27(2):752–759. doi: 10.1016/j.tiv.2012.12.016. [DOI] [PubMed] [Google Scholar]
- Pons T, Uyeda HT, Medintz I, Mattoussi H. Hydrodynamic dimensions, electrophoretic mobility, and stability of hydrophilic quantum dots. J. Phys. Chem. B. 2006;110(41):20308–20316. doi: 10.1021/jp065041h. [DOI] [PubMed] [Google Scholar]
- Durisic N, Wiseman P, Grutter P, Heyes CD. A common mechanism underlies the dark fraction formation and fluorescence blinking of quantum dots. ACS Nano. 2009;3(5):1167–1175. doi: 10.1021/nn800684z. [DOI] [PubMed] [Google Scholar]
- Vermehren-Schmaedick A, et al. Heterogeneous intracellular trafficking dynamics of brain-derived neurotropic factor complexes in the neuronal soma revealed by single quantum dot tracking. PLoS ONE. 2014;9(4):e95113. doi: 10.1371/journal.pone.0095113. [DOI] [PMC free article] [PubMed] [Google Scholar]


