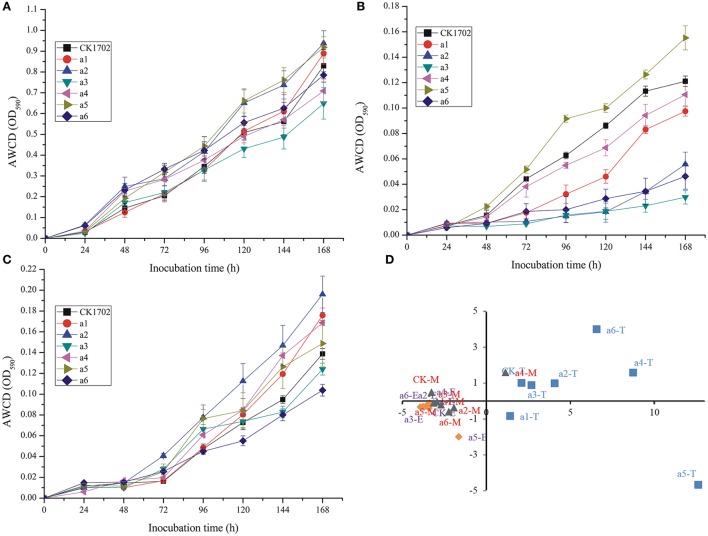
Figure 2.
Effects of cry1Ac sugarcane on average well color development (AWCD) during incubation of rhizosphere soil microorganisims and principal component analysis (PCA) based on Biolog EcoPlate results. (A) AWCD at the tillering stage; (B) AWCD at the elongation stage; (C) AWCD at the maturing stage. Vertical bars indicate standard error of the means (Mean ± SE, n = 3). (D) PCA; T, the tillering stage; E, the elongation stage; M, the maturating stage. CK, FN95–1702 (control line). a1, a2, a3, a4, a5, a6: cry1Ac sugarcane lines.

