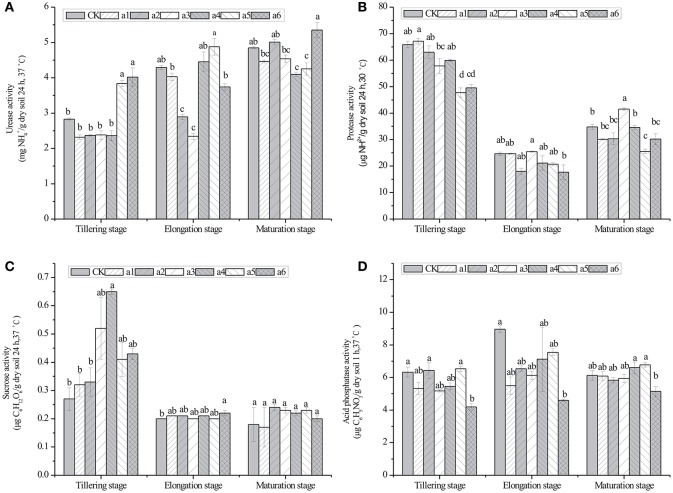
Figure 3.
Effects of cry1Ac sugarcane on activities of urease, protease, sucrose, and acid phosphatase in rhizosphere soil at the tillering, elongation and maturing stages. (A) urease activity; (B) protease activity; (C) sucrase activity; (D) acid phosphatase activity. CK, control line FN95–1702. Vertical bars indicate standard error of the means (Mean ± SE, N = 3). The same letters represent no statistically significant differencewith the control line (P < 0.05 level). CK, control line FN95–1702. a1, a2, a3, a4, a5, a6: cry1Ac sugarcane lines.

