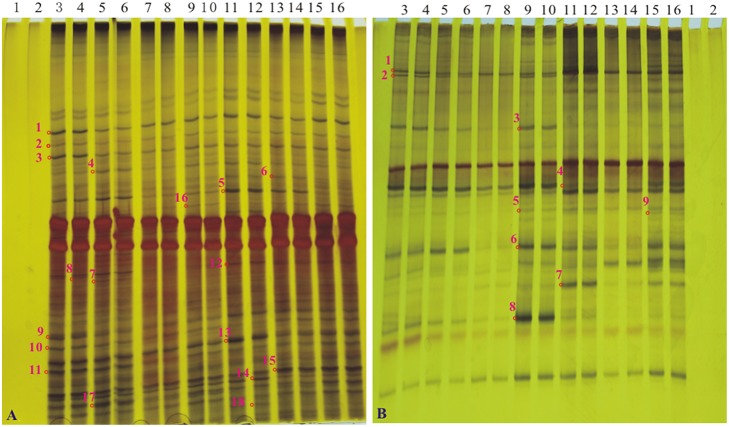
Figure 4.
The profiles of DGGE of soil bacterial 16S rDNA gene and soil fungal 18S rDNA gene at the tillering stage. (A) the profile of DGGE of soil bacterial 16S rDNA; (B) the profile of DGGE of soil bacterial 18S rDNA. Lanes 1 and 2, H2O; lanes 3 and 4, sugarcane line FN95–1702; lanes 5 and 6, a1; lanes 7 and 8, a2; lanes 9 and 10, a3; lanes 11 and 12, a4; lanes 13 and 14, a5; lanes 15 and 16, a6. Bands 1–18 in A and bands 1–9 in B (marked as “o” with numbers along side it), The interested bands (present/absent or different intensity) were excised from the DGGE gel.

