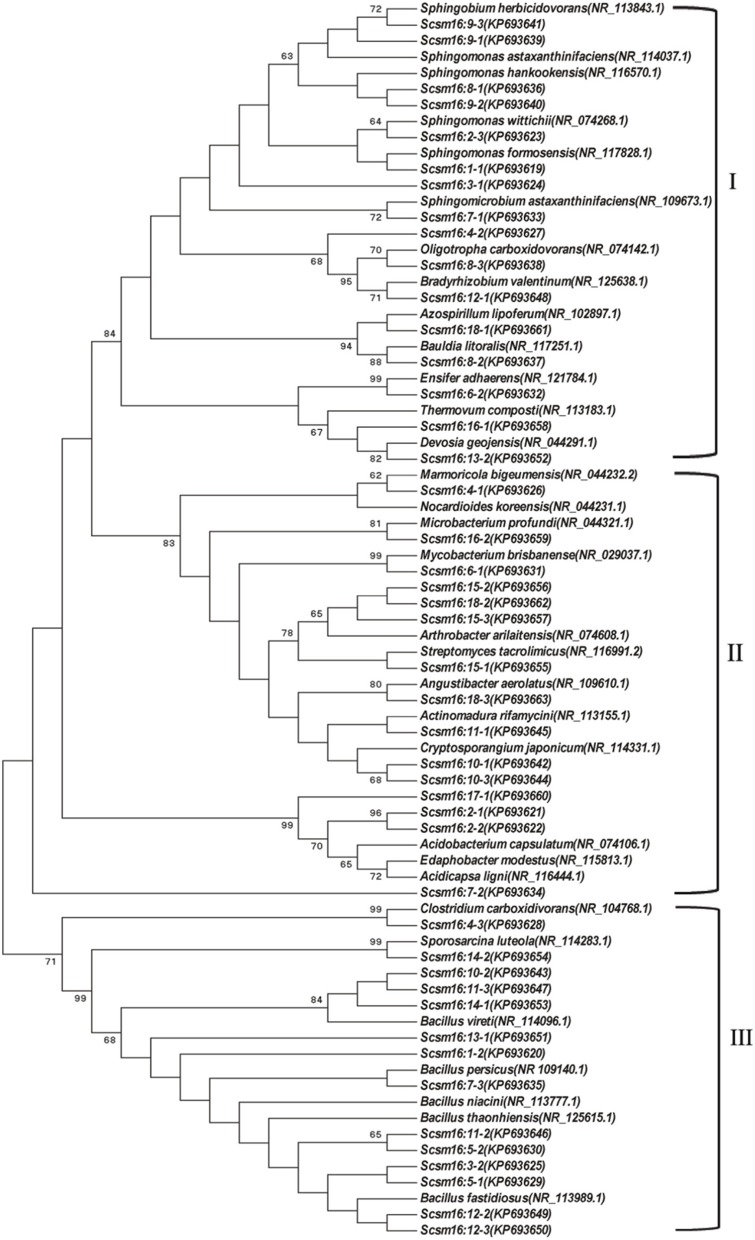
Figure 5.
Phylogenetic tree showing the relationship between the individual bacterial 16S rDNA genes from the cultivated soil under cry1Ac and non-GM sugarcane. The numbers before transverse line represent different band marked in “o” with numbers (in Figure 4A), while the numbers after the transverse line represent different positive sub-clones. I, Proteobacteria; II, Actinobacteria; III, Firmicutes.

