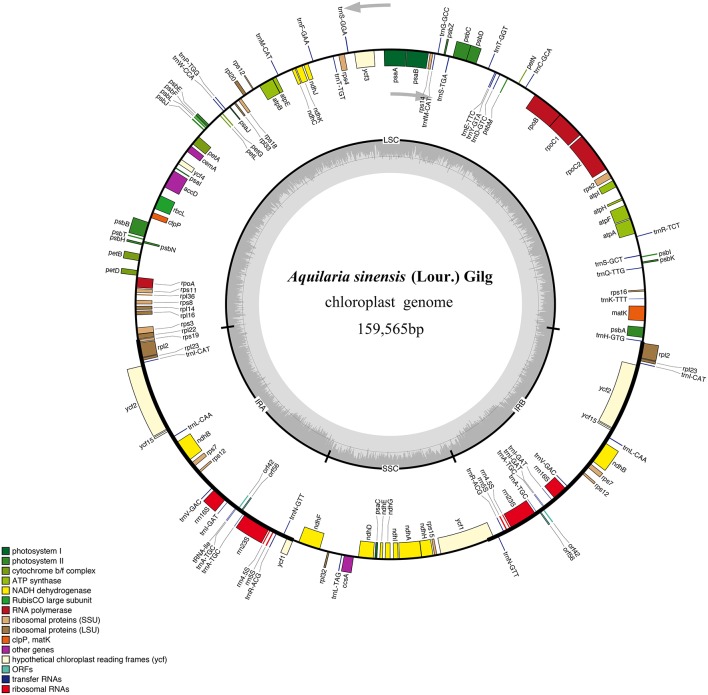
Figure 1.
Gene map of A. sinensis chloroplast (cp) genome sequence. Organization of the cp genome of A. sinensis showing annotated genes. Genes drawn inside the circle are transcribed clockwise, and those outside are counter clockwise. Genes belonging to different functional groups are color-coded. The inner circle shows the locations of the large single-copy region, small single-copy, and the pair of inverted repeats (IRa and IRb). The darker gray in the inner circle corresponds to GC content, whereas the lighter gray corresponds to AT content.

