
Figure 4.
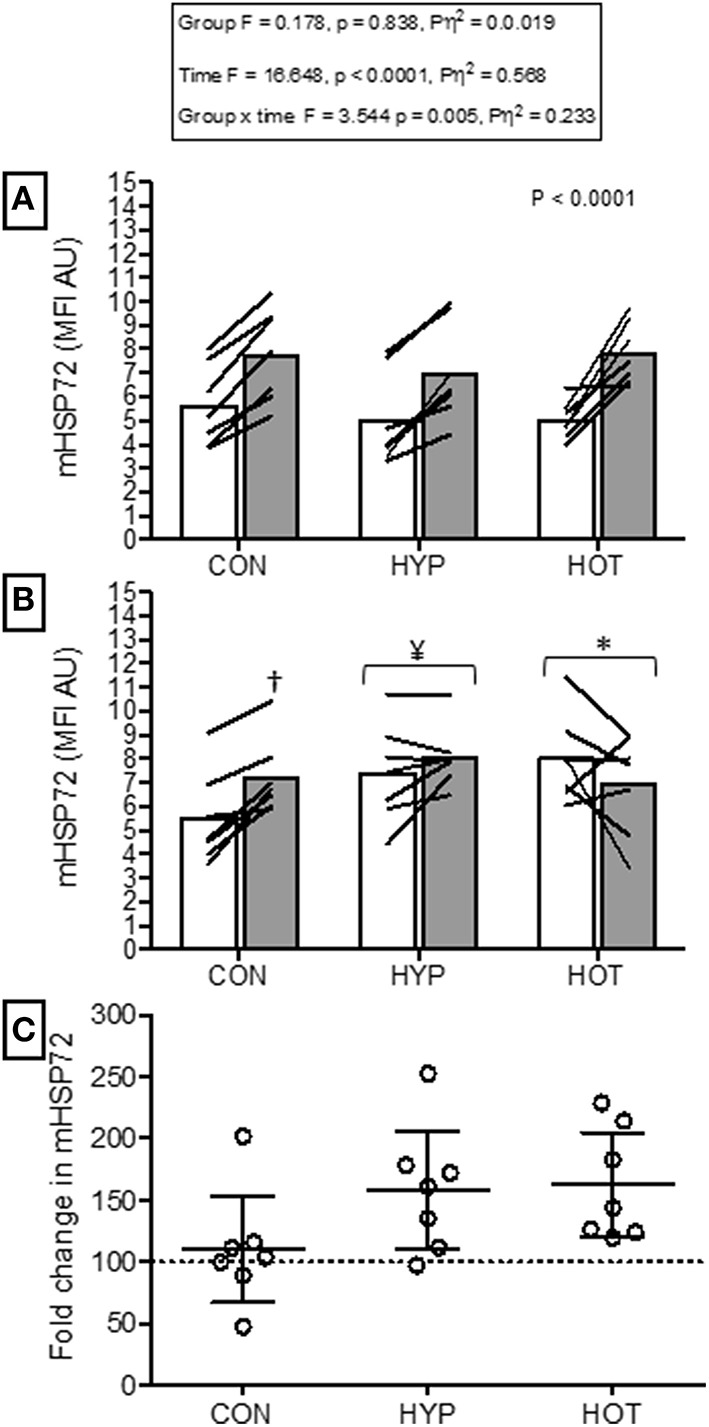
Monocyte HSP72 before and after HST1 and HST2. (A) mHSP72 is increased after a HST in 20 of 21 participants. (B) Resting mHSP72 was increased prior to onset of HST2 in HYP and HOT. The post exercise increase in mHSP72 was subsequently only observed in CON. (C) The magnitude of change in resting mHSP72 prior to HST2 was not different between HYP and HOT and were each elevated in comparison to CON. Lines (A,B) and dots (C) represent individual participant responses and bars the mean group response (n = 21). The dashed line (C) represents baseline mHSP72. †Different from pre-exercise (p < 0.01). ¥Different from HST1 pre-exercise (p < 0.05). *Different from HST1 pre-exercise (p < 0.01).