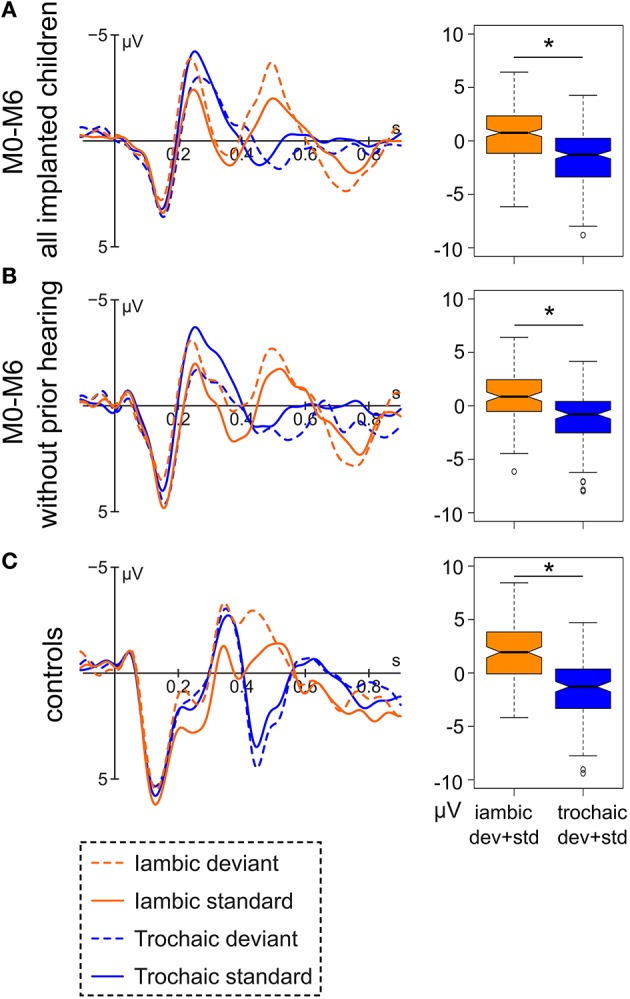
Figure 2.

Left: Grand average of (A) the data of all hearing-impaired children after implantation (M0-M6; N = 47), (B) of the subgroup of congenitally deaf children after implantation (N = 19), and (C) all normal hearing controls (N = 24) at electrode Fz. Right: Respective boxplot representation of the amplitude difference between the iambic and the trochaic stimuli averaged over deviant and standard in the range of 444–544 ms (implanted children) and 404–504 ms (controls). Significant differences between the two stress patterns (p < 0.05) are marked by an asterisk.
