FIGURE 4.

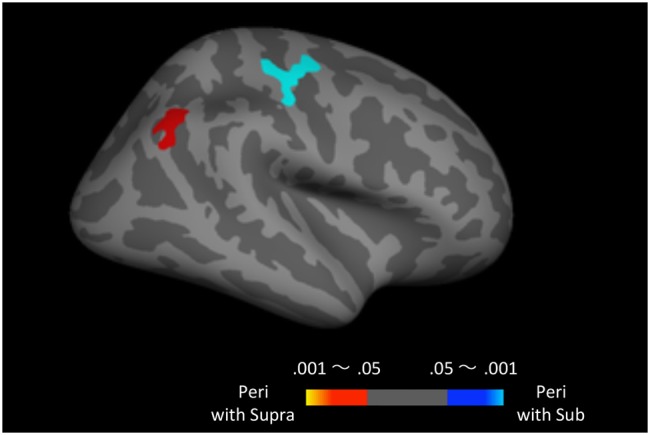
Peri-second trials intermixed with supra-second trials versus peri-second trials intermixed with sub-second trials. The color scales indicate the cluster-wise corrected P-value.

Peri-second trials intermixed with supra-second trials versus peri-second trials intermixed with sub-second trials. The color scales indicate the cluster-wise corrected P-value.