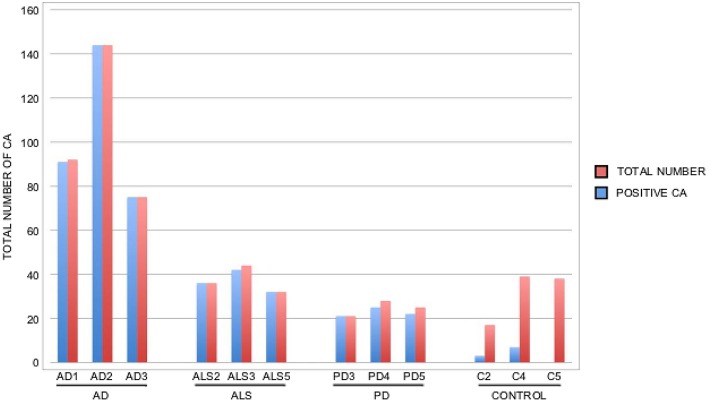
Figure 7.
Quantitation of the number and positiveness of CA from different patients and control subjects. Brain sections from the patients indicated in the Figure were examined by confocal microscopy and the total number of CA in three different fields was estimated, as well as their staining with anti-P. betae antibodies. Wide fields were analyzed using 40x magnification. The sections examined were ERC from AD patients and control subjects, MD from ALS patients, PD3 and PD5 and MC from PD4. Red bar: total number of CA in the three fields; blue bar: positive CA with antifungal antibody.

