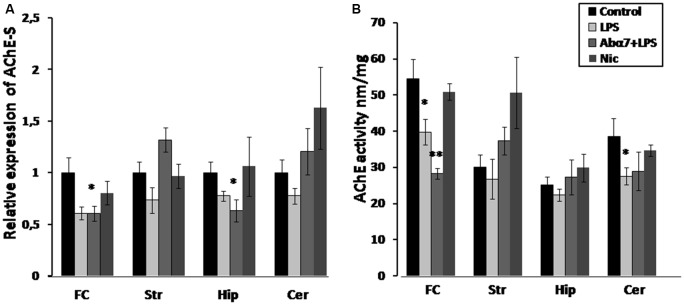
Figure 3.
Transcript levels (A) and enzyme activity (B) of acetylcholinesterase-S (AChE-S) in various brain regions of mice treated with LPS, α7(1–208)-specific antibody + LPS or nicotine (3 days) compared to non-treated mice. Designations are similar to those in Figure 2. *p < 0.05; **p < 0.005 compared to Control (n = 8).

