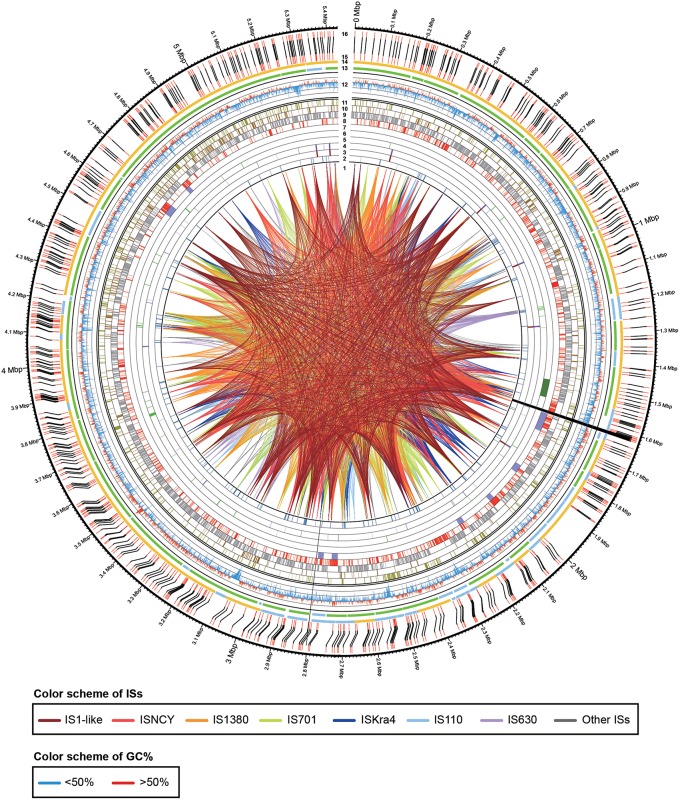
Figure 1.
Physical and genetic maps of the genome of E. montiporae. The track numbers represent: (1), IS linkages; (2), pseudogenes; (3), rRNA operons; (4), tRNAs; (5), eukaryotic domain proteins; (6), testosterone degrading gene cluster; (7), prophage regions; (8), unique genes in E. montiporae; (9), conserved genes in three Endozoicomonas; (10), genes shared with E. numazuensis; (11), genes shared with E. elysicola; (12), GC profile (red, > 50%; blue, < 50%); (13), ALLPATH-LG assembled scaffolds (green, orientated by MpSolver; light blue, orientated in gap filling process); (14), SMRTAnalysis assembled scaffolds (yellow, orientated by MpSolver; light blue, orientated in gap filling process); (15), AflII pattern from assembled sequences; (16) physical map (AflII cuts) generated with optical mapping technology. The black lines that connect track 15 and 16 indicated the alignment of AflII cuts from assemble genome sequence and physical map. The two assembly gaps are indicated by black near position 1.6 and 2.8 Mbp.

