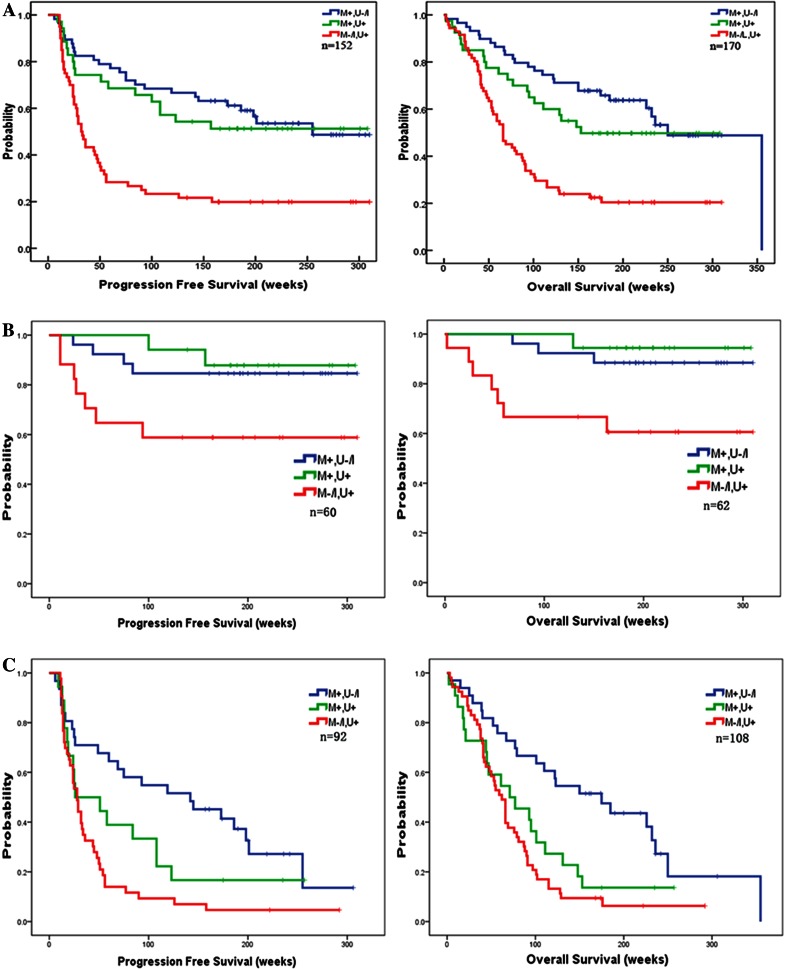
Fig. 2.
Kaplan–Meier plots showing a correlation of CD133 methylation status with PFS and OS. a The Kaplan–Meier plots of CD133 methylation status. The PFS and OS of patients with unmethylated CD133 promoter was 91.0 weeks (95 % CI, 61.3–120.8) and 113.7 weeks (95 % CI, 87.1–140.3), respectively. While, patients with methylated CD133 promoter showed a tendency to an increased PFS (189.7 weeks, 95 % CI, 164.1–215.3) and OS (218.9 weeks, 95 % CI, 200.4–271.6). b The Kaplan–Meier plots of CD133 methylation status in LGG. The PFS and OS of LGG patients with unmethylated CD133 promoter was 197.1 weeks (95 % CI, 132.5–261.8) and 209.6 weeks (95 % CI, 150.1–269.1), respectively. While, patients with methylated CD133 promoter showed a tendency to an increased PFS (271.0 weeks, 95 % CI, 235.7–306.3) and OS (286.2 weeks, 95 % CI, 260.5–311.9). c The Kaplan–Meier plots of CD133 methylation status in HGG.The PFS and OS of HGG patients with unmethylated CD133 promoter was 47.7 weeks (95 % CI, 29.3–66.1) and 77.1 weeks (95 % CI, 58.7–95.4), respectively. While, patients with methylated CD133 promoter showed a tendency to an increased PFS (139.5 weeks, 95 % CI, 100.5–178.5) and OS (172.2 weeks, 95 % CI, 128.8–215.7)

