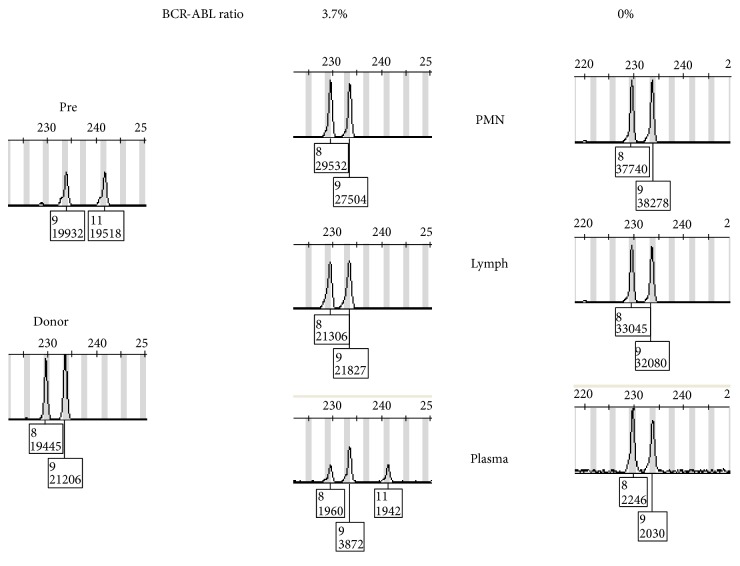
Figure 2.
Chimerism pattern in a patient with CML treated with HSCT. Pretransplant and donor patterns are shown in the left panel. The middle and right panels show the patterns in PMN, lymphocytes, and plasma at two different points. The BCR-ABL fusion level as detected by RT/PCR is shown on top. The middle sample shows mixed chimerism in plasma only as well as residual BCR-ABL1 fusion RNA. The right panel shows the disappearance of the recipient DNA and fusion BCR-ABL1.

