
Figure 4.
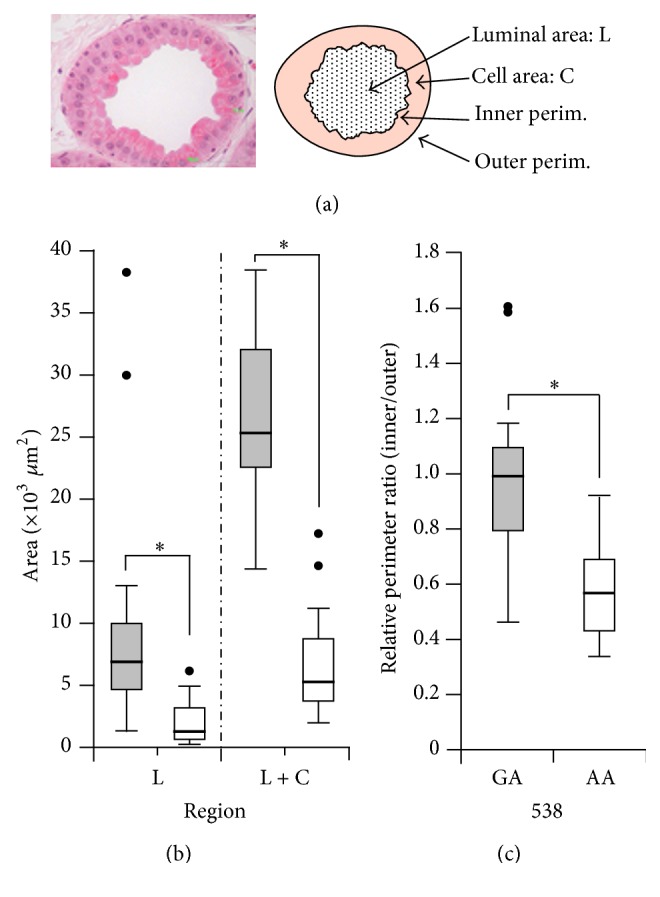
Image analysis of human apocrine glands with ABCC11 538GA and 538AA. (a) Typical image of human apocrine glands in the external auditory canal (left). Schematic illustration of measurement parameters for image analysis (right). (b and c) Well-developed apocrine glands in a subject with ABCC11 538GA (grey) as compared with a subject with 538AA (white). Histological images of human apocrine glands [1] were analyzed by the ImageJ program (v1.46d). Calculated data are expressed as box plots. Differences were considered significant when p < 0.01 (∗).