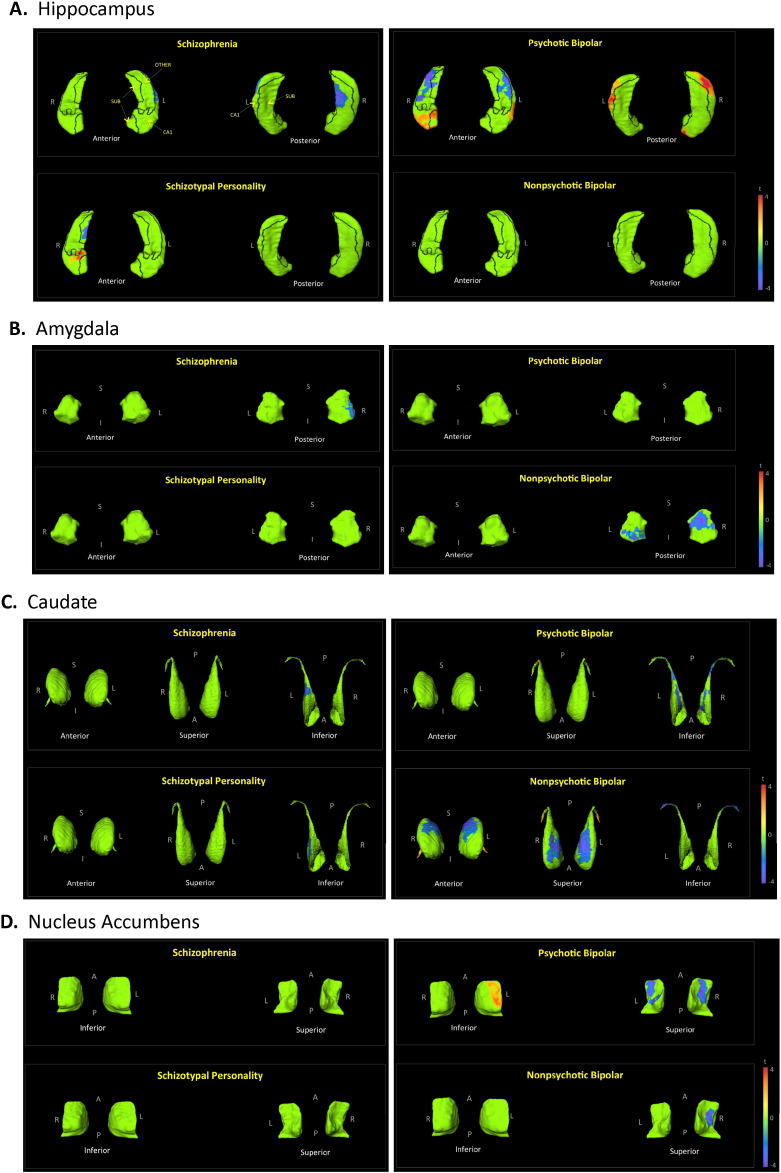
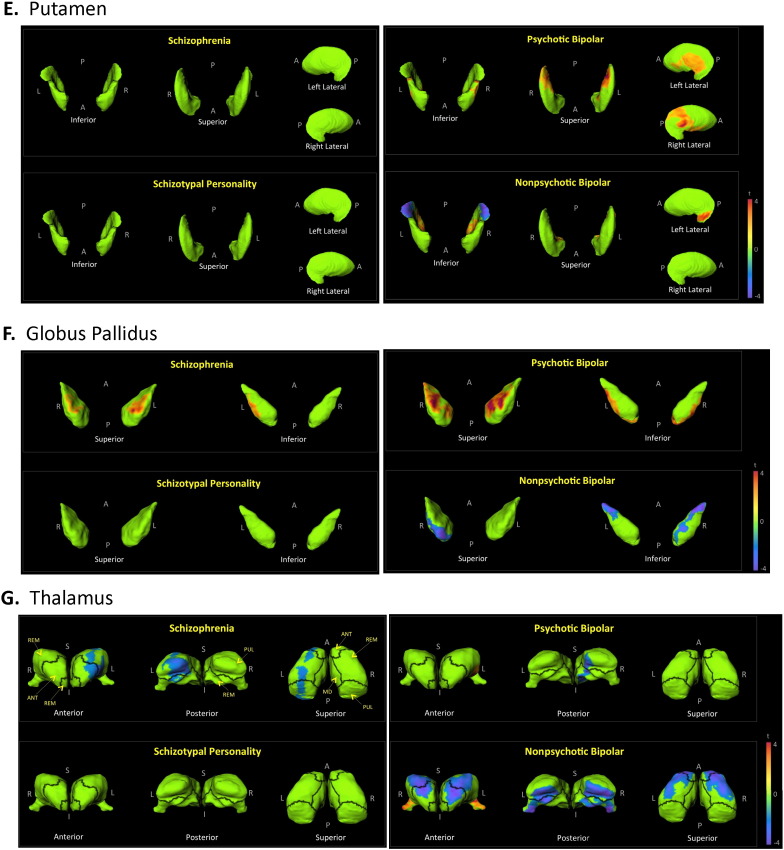
Fig. 1.
Shape analysis of individual subcortical structures. The figures depict displacement maps, generated from mean surfaces of the indicated diagnostic groups relative to healthy controls, for the: hippocampus (A), amygdala (B), caudate (C), nucleus accumbens (D), putamen (E), globus pallidus (F), and thalamus (G). Results were corrected for age and sex. Demarcation lines on hippocampal and thalamic surfaces separate designated subfields or nuclei, and are indicated on the first listed comparisons. Hippocampal subfields: CA1, subiculum (SUB), and the remaining regions which include CA2, CA3, CA4 and the dentate gyrus (REM). Thalamic nuclei: anterior nucleus (ANT), medial dorsal nucleus (MD), pulvinar (PUL), and the remaining nuclei (REM), which include the lateral dorsal, lateral posterior, ventral anterior, ventral lateral, ventral intermedial, and ventral posterior nuclei, as well as the medial and lateral geniculate bodies. Regions in green did not show significant group differences after RFT multiple comparison correction. T-values with cooler colors (t < 0) indicate inward surface deformity, and warmer colors (t > 0) indicate outward surface deformity. (For interpretation of the references to color in this figure legend, the reader is referred to the web version of this article.)


