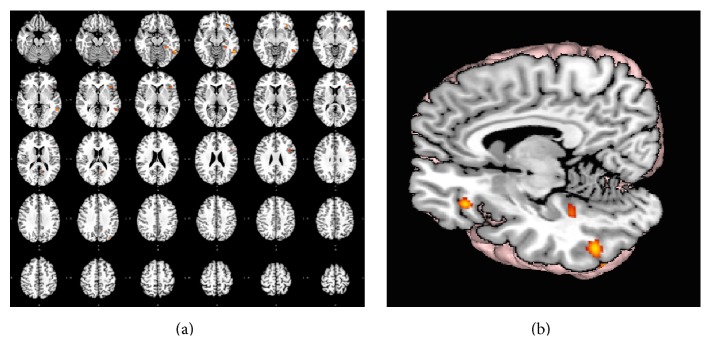
Figure 1.
Functional connectivity map of BA20 by Meta-Analytic Connectivity Modeling. (a) Transversal descending cuts of the brain MRI template. Left hemisphere appears on the left side (neurological convention). Clusters of activation are color coded for statistical significance from dark blue (lowest) to red (highest). (b) 3D volumetric rendition of the brain showing activation on the left hemisphere surface. Red color zone identifies BA20. Deep and midline activations are shown.

