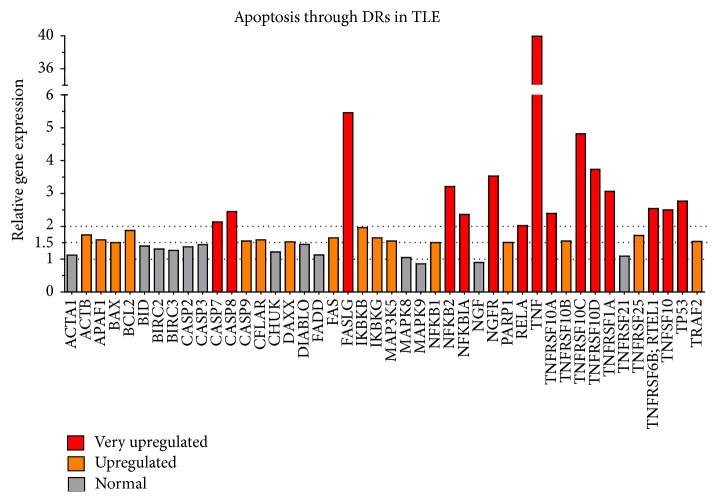
Figure 1.
Hippocampal expression of genes associated with apoptosis through death receptors in TLE(HS) patients versus post mortem controls. The combination of GAPDH and HPRT1 was used as the reference gene. The pool of post mortem control samples (n = 4) was the reference sample (calibrator) and its relative quantification (RQ) was always 1.0. Different colors represent gene expression in RQ values (or fold-change values, when RQ is a positive number) and correspond to the following parameters: red = very upregulated (RQ ≥ 2.0); orange = upregulated (1.99 ≥ RQ ≥ 1.5); gray = normal (1.49 ≥ RQ ≥ 0.67). None of the 44 target genes analyzed was downregulated (0.66 ≥ RQ ≥ 0.51) or very downregulated (RQ ≤ 0.5).

