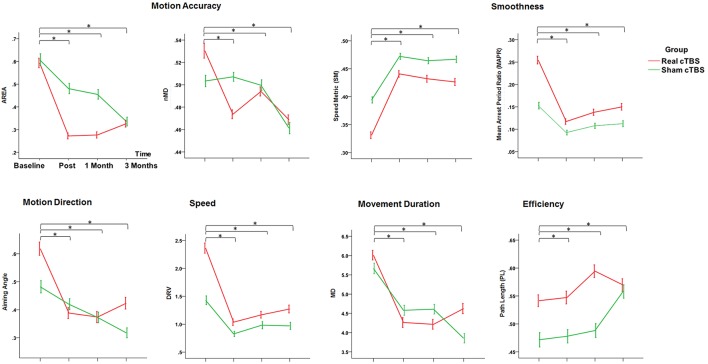
Figure 4.
Changes in the Secondary Outcome Measures (motor performance parameters extracted by the robot) in the Real (red line) and the Sham (green line) cTBS groups. Compared to Baseline both groups significantly improved at t1 (post-treatment), t2 (1 month), and t3 (3 months) *p < 0.05. There is no difference between groups.

