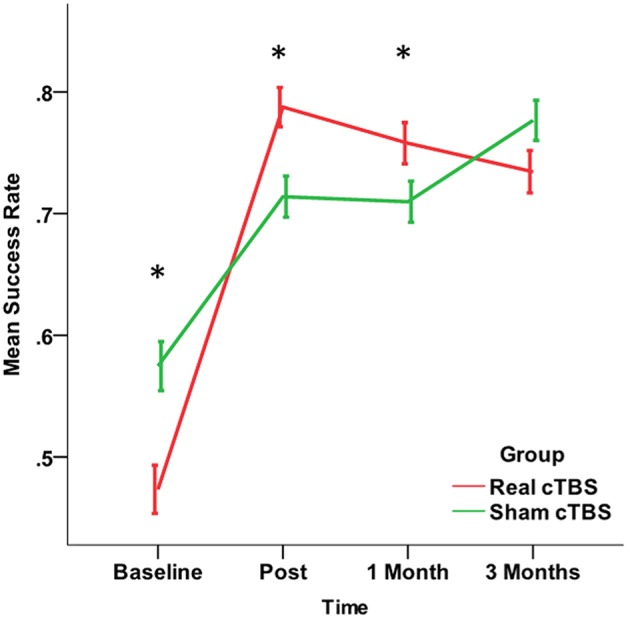
Figure 5.

Changes in the Success Rate, a secondary Outcome Measure broader measure of motor performance representing the percentage of times that the patient reaches the target. The improvement in the real cTBS group was higher than in the sham group at t1 (post-treatment) and t2 (1 month). *p < 0.05.
