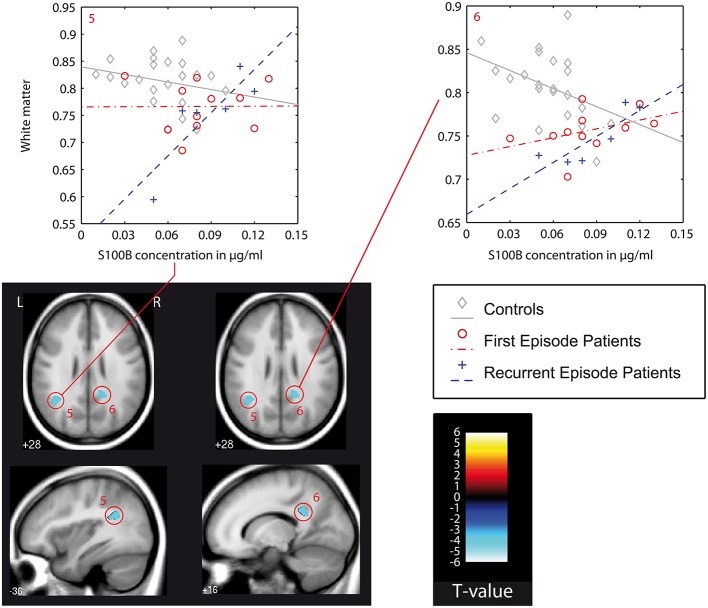
Figure 3.
VBM-based interaction analysis: control group (C) vs. recurrent episode patients (REP). Presentation as in Figure 2. In this figure also: color bar (T-values) and color/symbol coding for scatter plots in Figures 2–4: gray, C, controls; red, FEP, first episode patients; blue, REP, recurrent episode patients.

