
Figure 4.
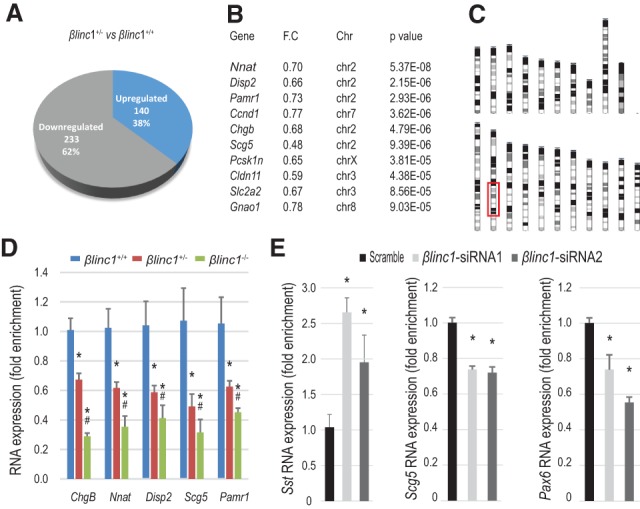
βlinc1 predominantly regulates the expression of β-cell-enriched genes that map to the same chromosomal region as βlinc1. (A) Pie chart showing the total numbers and relative percentages of up-regulated and down-regulated genes (P < 0.05) in βlinc1+/− versus βlinc1+/+. (B) Fold change and chromosomal location of the 10 most significantly down-regulated genes in βlinc1+/− compared with βlinc1+/+. A large proportion of these genes is in chromosome 2 (Supplemental Fig. 10a). (C) Schematic representation of the mouse karyotype. The red box denotes the location of the dysregulated genes on chromosome 2 in βlinc1+/− compared with βlinc1+/+ mice. (D) qRT–PCR validation of RNA-seq results for the genes located in chromosome 2. (*) P < 0.05 versus βlinc1+/+; (#) P < 0.05 versus βlinc1+/−. (E) Down-regulation of βlinc1 with two different siRNAs in MIN6 cells recapitulates the increase in somatostatin expression and down-regulation of Scg5 and Pax6 seen in vivo. n = 4. Error bars represent ±SEM. (*) P < 0.05 versus scrambled. Student's t-test.