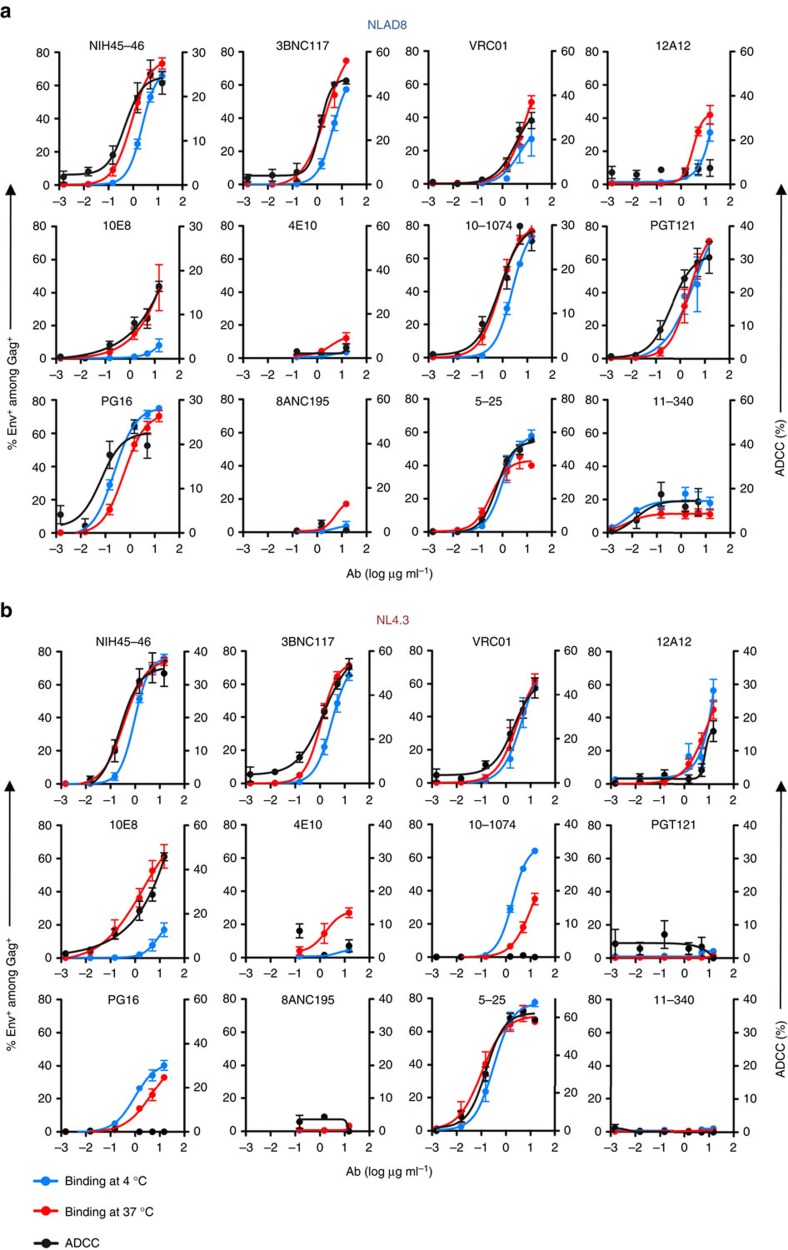
Figure 4. Dose–response analysis of binding of bNAbs and ADCC activity against HIV-1-infected lymphocytes.
CEM-NKR cells infected with HIV-1 NLAD8 (a) or NL4.3 (b) were incubated with the indicated concentrations of antibodies at 4 or 37 °C and surface levels were analysed by flow cytometry. The numbers indicate the % of bNAb+ cells among infected (Gag+) cells (left axis) and the % of ADCC (right axis). ADCC y axes were adjusted for each antibody to facilitate comparisons with the binding profile. For measurement of ADCC, HIV-1-infected CEM-NKR cells were incubated with the indicated antibodies and with NK cells. After 4 h, the % of Gag+ CEM-NKR target cells was measured by flow cytometry. The % of ADCC was calculated as the disappearance of Gag+ cells (N=3 independent experiments for binding; killing assays were performed using at least two NK cell donors; Error bars indicate s.e.m.).

