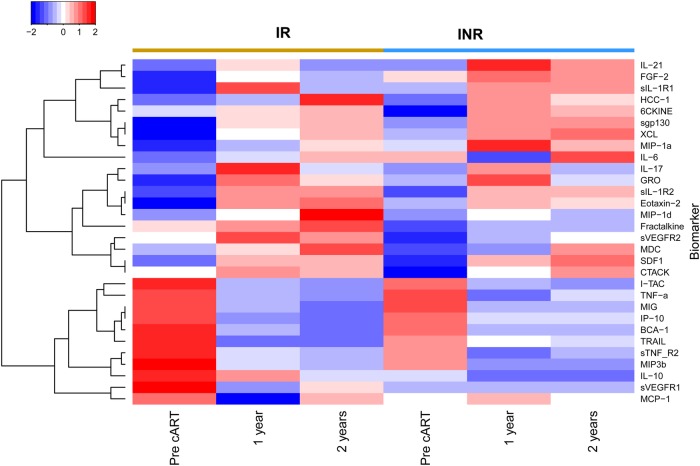
Figure 3.
Cytokine levels in immunological responder (IR) and immunological nonresponder (INR) subjects before and after combination antiretroviral therapy (cART). Subjects are grouped in columns according to clinical group, with time points displayed below. Cytokine values are shown as the mean log10 value of all subjects within a given group at each time point. Cytokines were clustered in an unsupervised fashion, with 2 main branches forming, analytes with levels that rose after suppressive cART, and below a group of analytes whose levels fell after suppressive cART.

