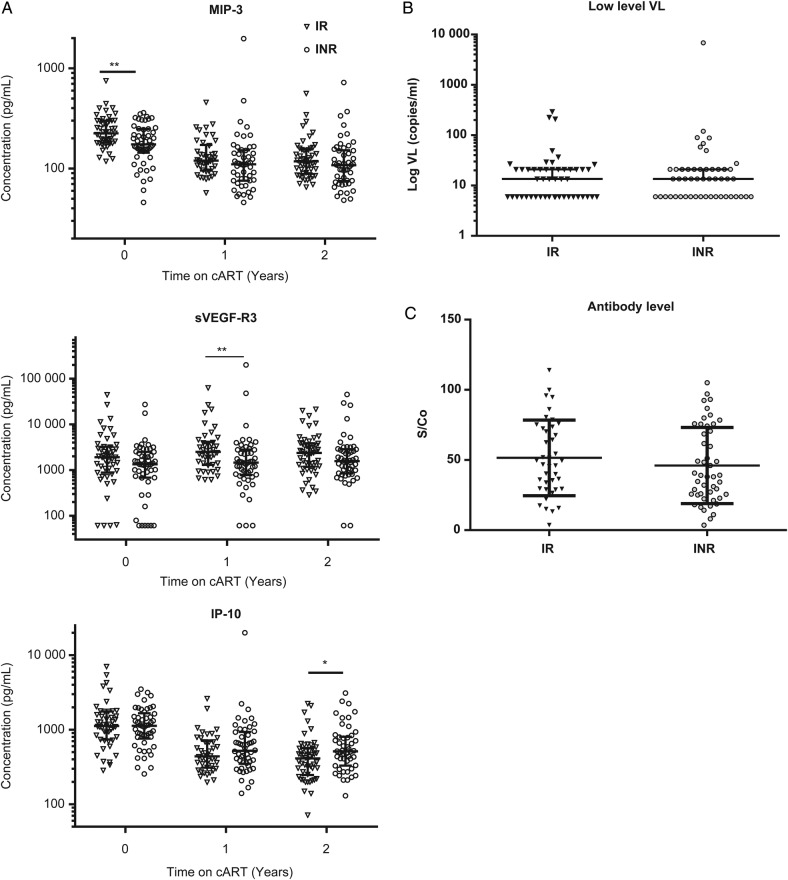
Figure 4.
Comparison of individual cytokines and low-level viral loads (VL) by clinical group. (A) Individual data points over time are shown for each of the cytokines that showed a significant difference between immunological responder (IR) and immunological nonresponder (INR) groups. (B) Samples from the 2-year postsuppressive combination antiretroviral therapy (cART) initiation were retested using a transcription-mediated amplification (TMA) assay for human immunodeficiency virus (HIV) ribonucleic acid (RNA). Results are expressed as log10 viral load based on comparison of 2 replicate TMA results to a standard curve (see Methods). (C) Samples from the 2-year postsuppressive cART initiation were tested using a less-sensitive HIV antibody assay, with results reported as signal to cutoff (S/Co). Horizontal line signifies median, and error bars represent the interquartile range. Abbreviations: IP-10, interferon gamma-induced protein 10; MIP, macrophage inflammatory protein; sVEGFR, vascular endothelial growth factor.

