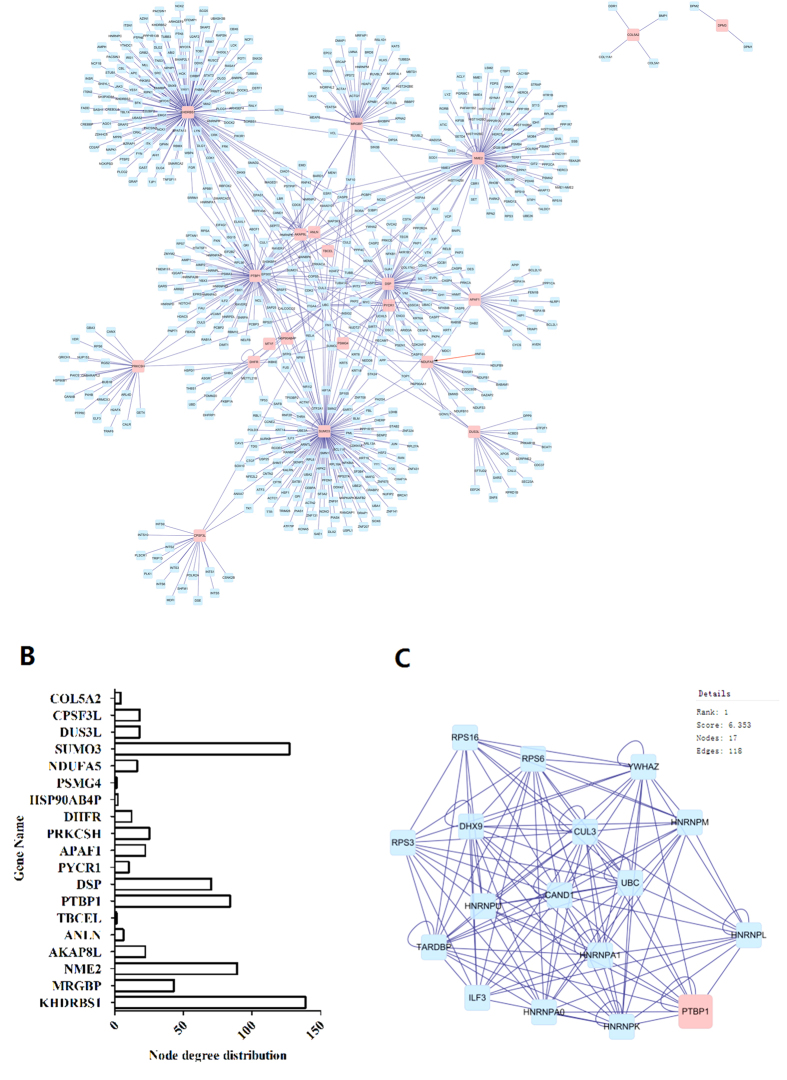
Figure 3. Network analysis using Cytoscape.
(A) Integrated regulatory network constructed using Cytoscape. The network includes two types of nodes: differentially expressed proteins identified from protein profiling (pink squares), and their interaction targets (blue squares) derived from six publically available databases. (B) Node degree distribution of differentially expressed proteins. (C) Cluster analysis ranking of the top hits in the B12 regulatory network using the cluster search algorithm MCODE.

