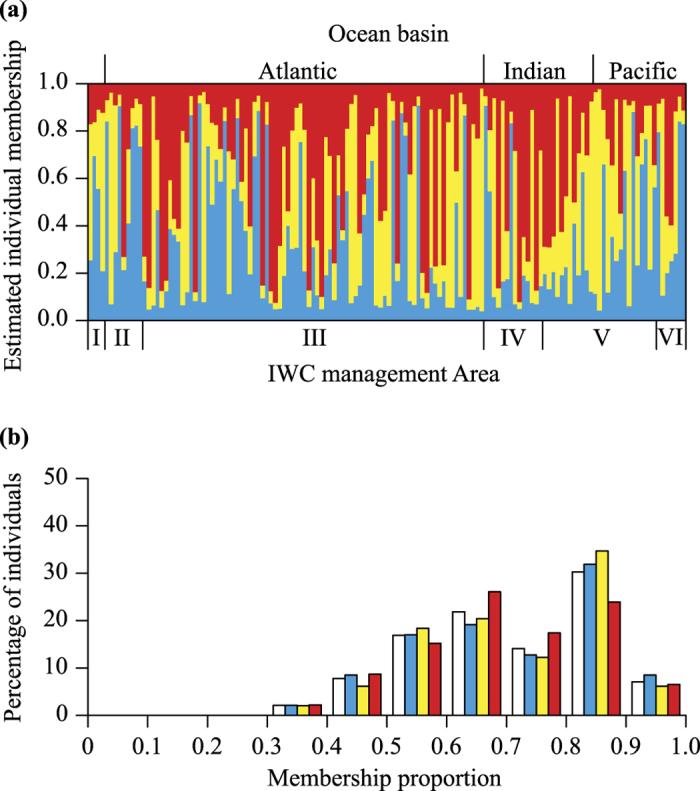
Figure 2. Clustering results of the STRUCTURE analysis for Antarctic blue whales using microsatellites when K is set to 3 and as summarized using CLUMPAK.

Population 1, blue or medium grey in greyscale; population 2, yellow or light grey in greyscale; population 3, red or dark grey in greyscale. (a) Estimated membership of each individual to each cluster. Each individual is represented by a column. Individuals are ordered according to the longitude at which they were sampled, starting from the western border of IWC management Area I. Individuals sampled at the same longitude were ordered from the oldest to the newest sample. The colouring of each column represents the proportion of estimated membership of each individual to each population. (b) Percentage distribution histogram of the highest membership proportion of Antarctic blue whales (white) and blue whales from each population.
