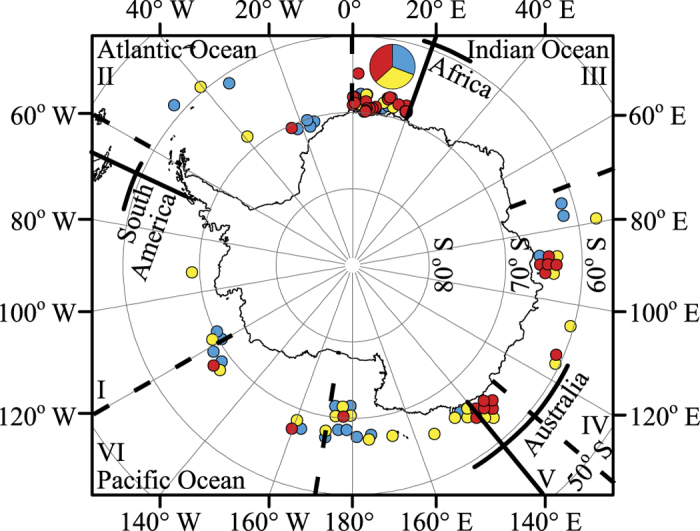
Figure 3. Polar map showing the biopsy sampling locations of individual blue whales off Antarctica.

Each individual is represented by a circle, which is shaded according to its highest cluster membership as estimated in STRUCTURE using microsatellites (population 1, blue or medium grey in greyscale; population 2, yellow or light grey in greyscale; population 3, red or dark grey in greyscale). Only the first recorded location is shown for individuals sampled more than once. The map position of individuals sampled from the same or similar locations has been slightly altered so that all individuals are visible, with the exception of individuals located from 0° to 20°E due to extensive sampling from this area (n = 81). A pie chart shows the proportion of individuals that belong to each STRUCTURE cluster in the area from 0° to 20°E. Borders of IWC management Areas I to VI (dashed, black latitudinal lines) and ocean basins (solid, black latitudinal lines; borders according to International Hydrographic Organization definitions110) are shown. The longitudes of the southern coasts of South America, Africa and Australia are indicated (solid, black longitudinal lines). The map was created using ARCGIS 10.0 (Esri).
